 36
36peptides
spectra
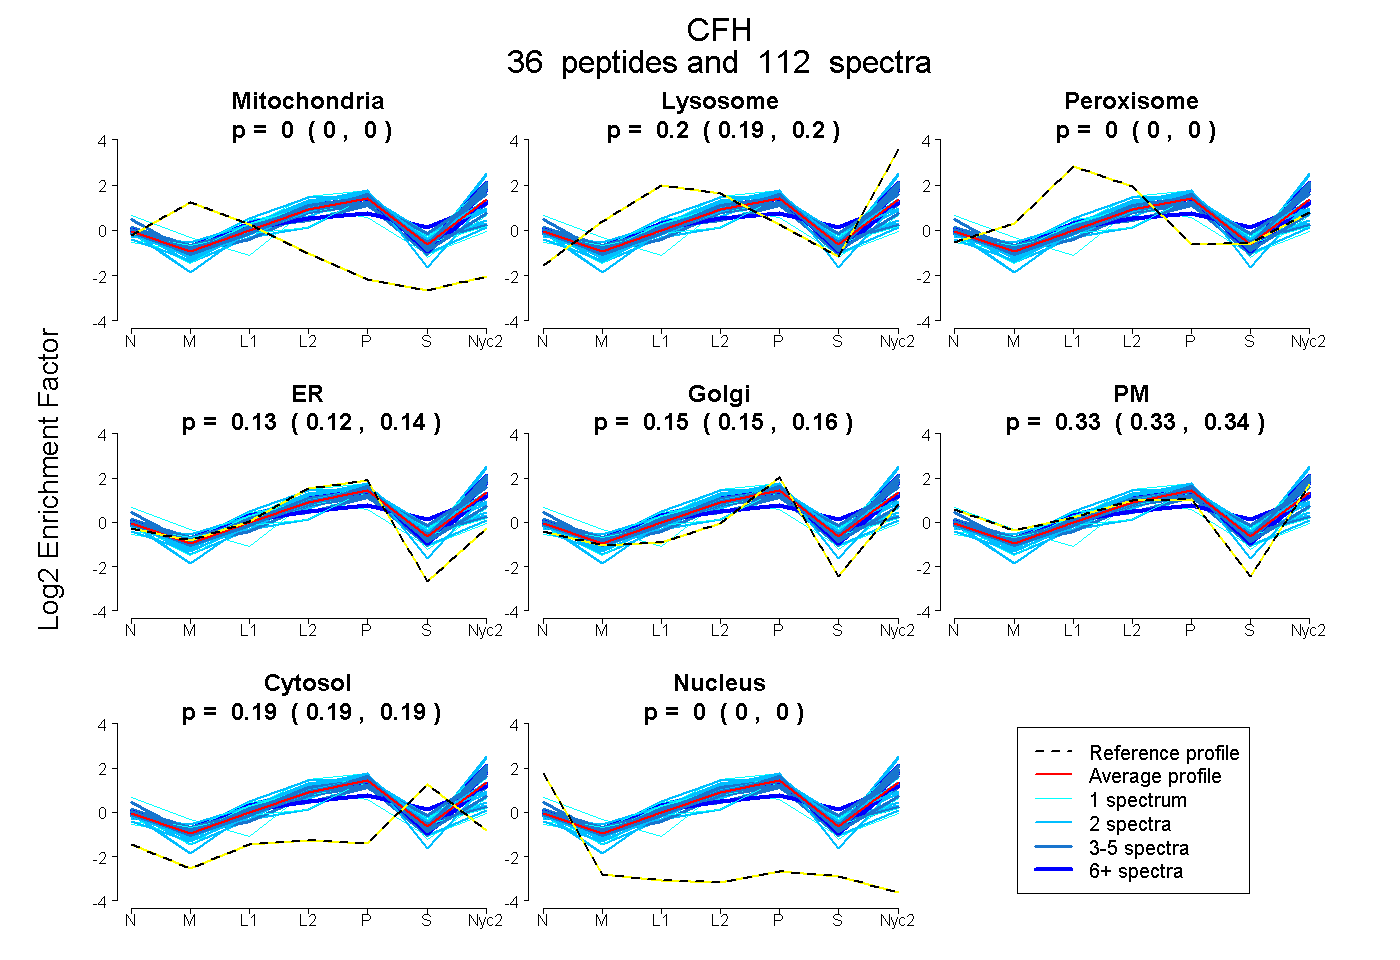
0.000 | 0.000
0.194 | 0.200
0.000 | 0.000
0.122 | 0.137
0.145 | 0.157
0.329 | 0.338
0.185 | 0.189
0.000 | 0.000
15peptides
spectra
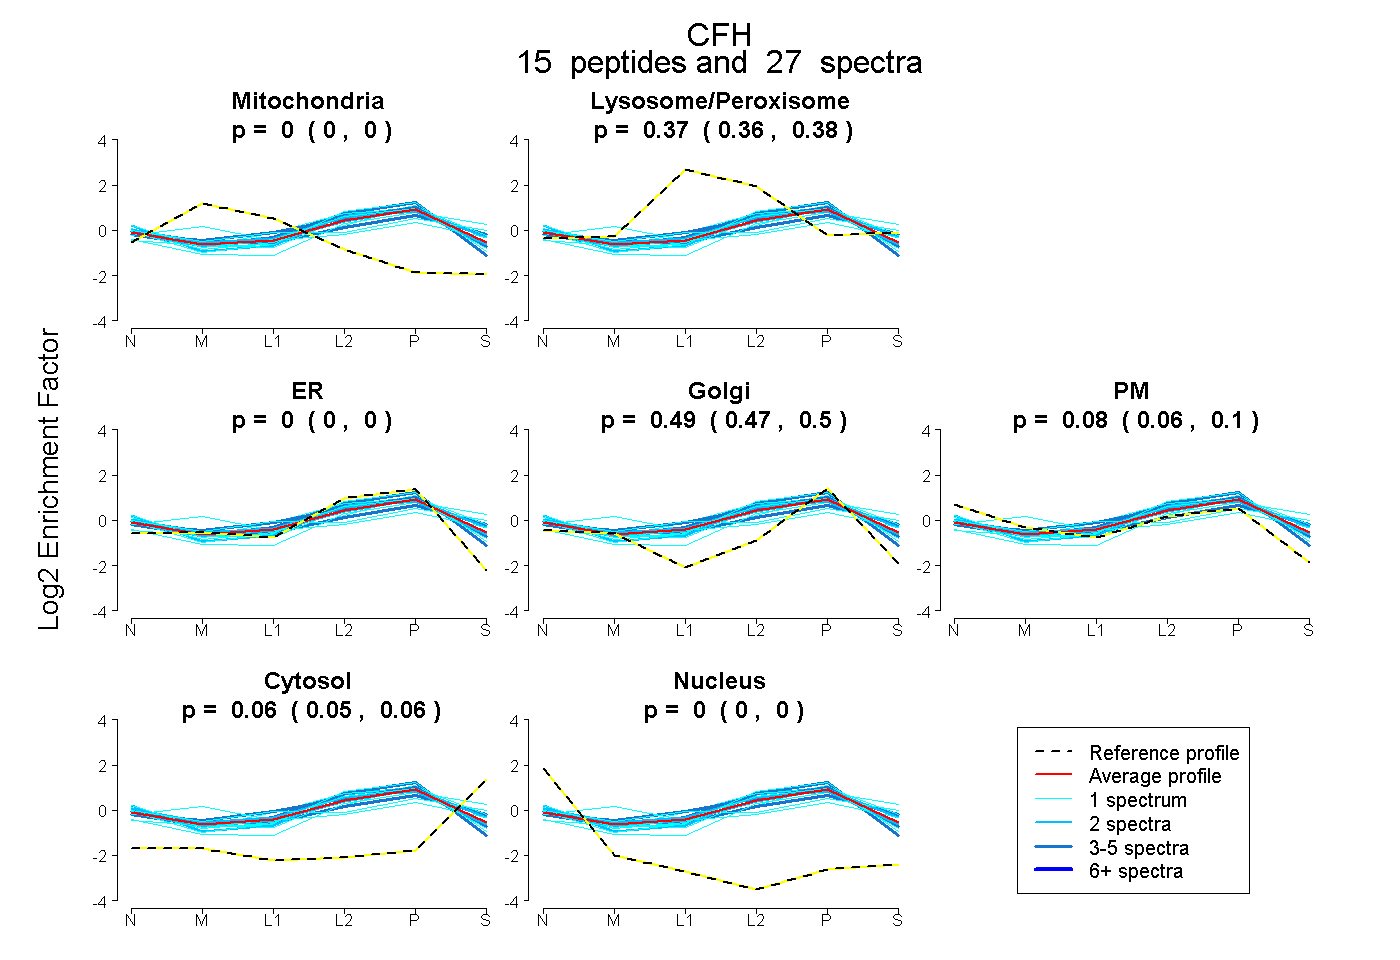
0.000 | 0.000
0.365 | 0.378
0.000 | 0.000
0.473 | 0.500
0.063 | 0.096
0.053 | 0.064
0.000 | 0.000
41peptides
spectra
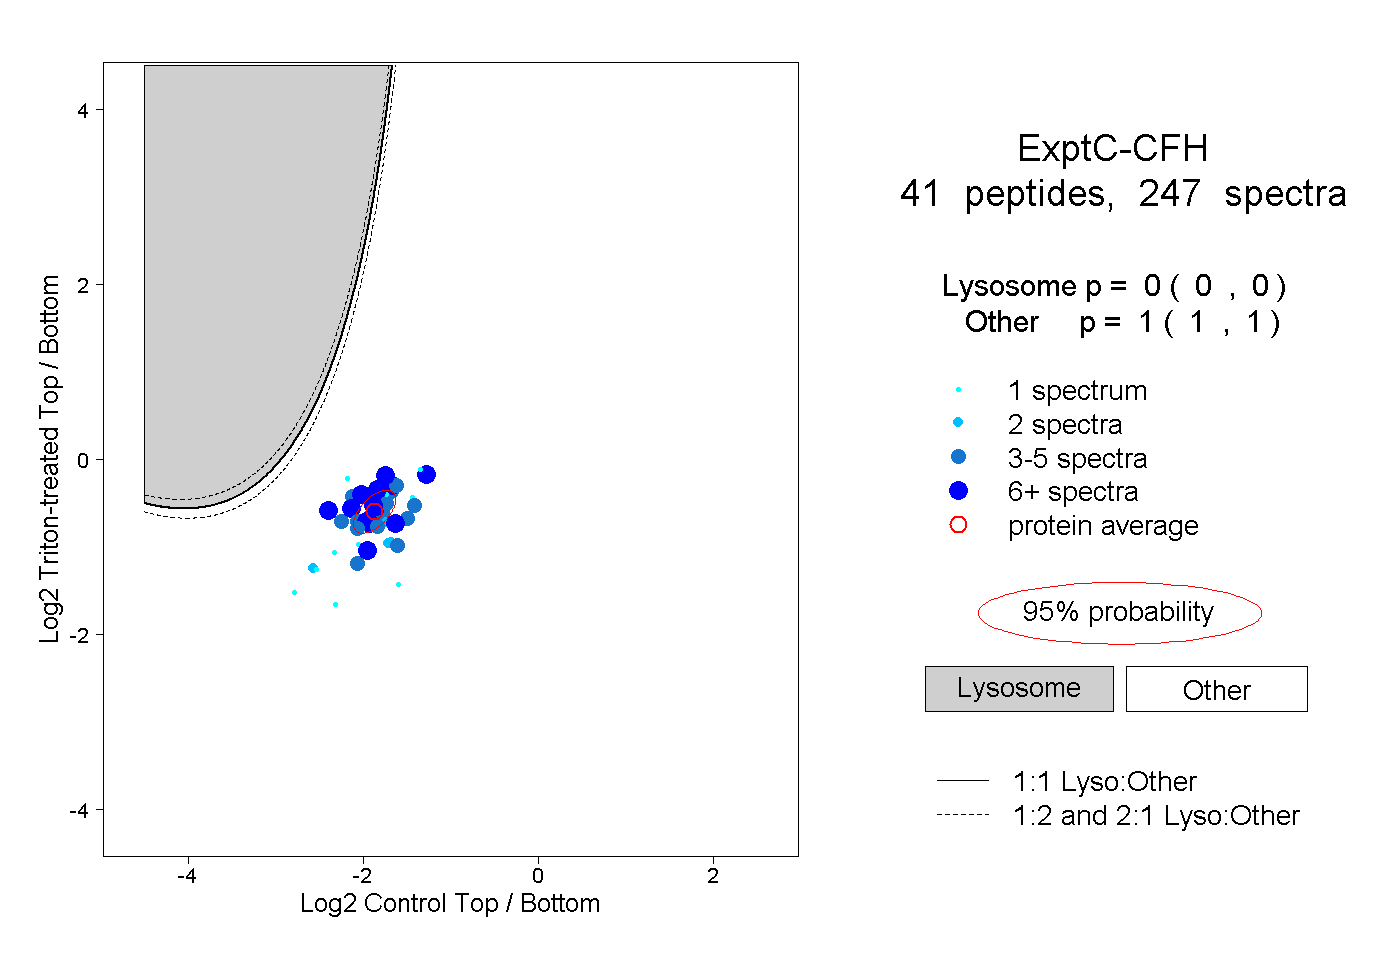
0.000 | 0.000
1.000 | 1.000
15peptides
spectra
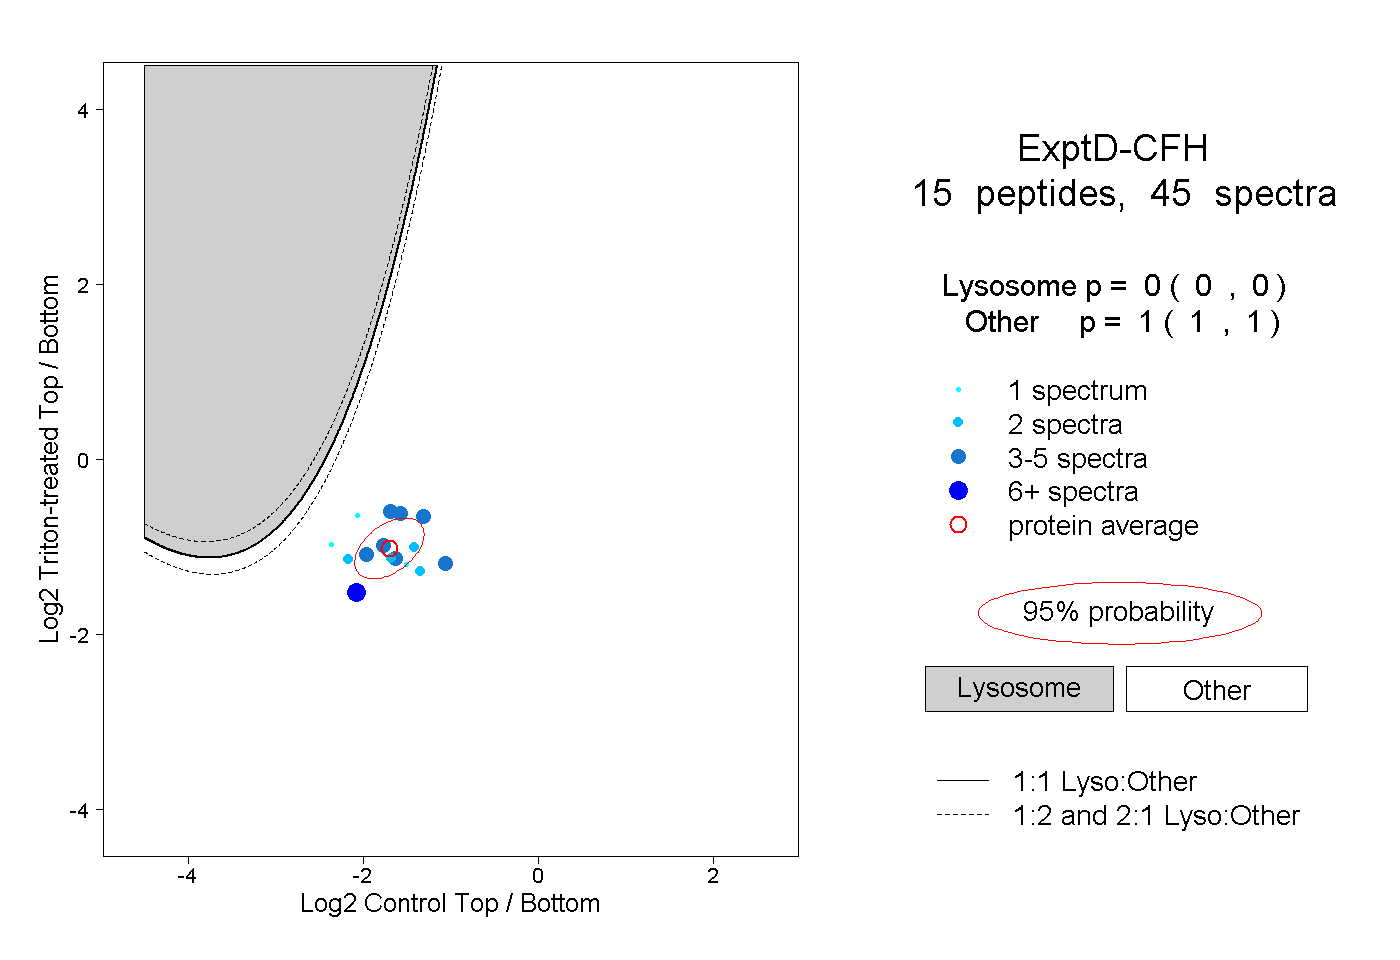
0.000 | 0.000
1.000 | 1.000