 36
36peptides
spectra
0.000 | 0.000
0.194 | 0.200
0.000 | 0.000
0.122 | 0.137
0.145 | 0.157
0.329 | 0.338
0.185 | 0.189
0.000 | 0.000
| Plot | Mito | Lyso | Perox | ER | Golgi | PM | Cytosol | Nucleus | |||||
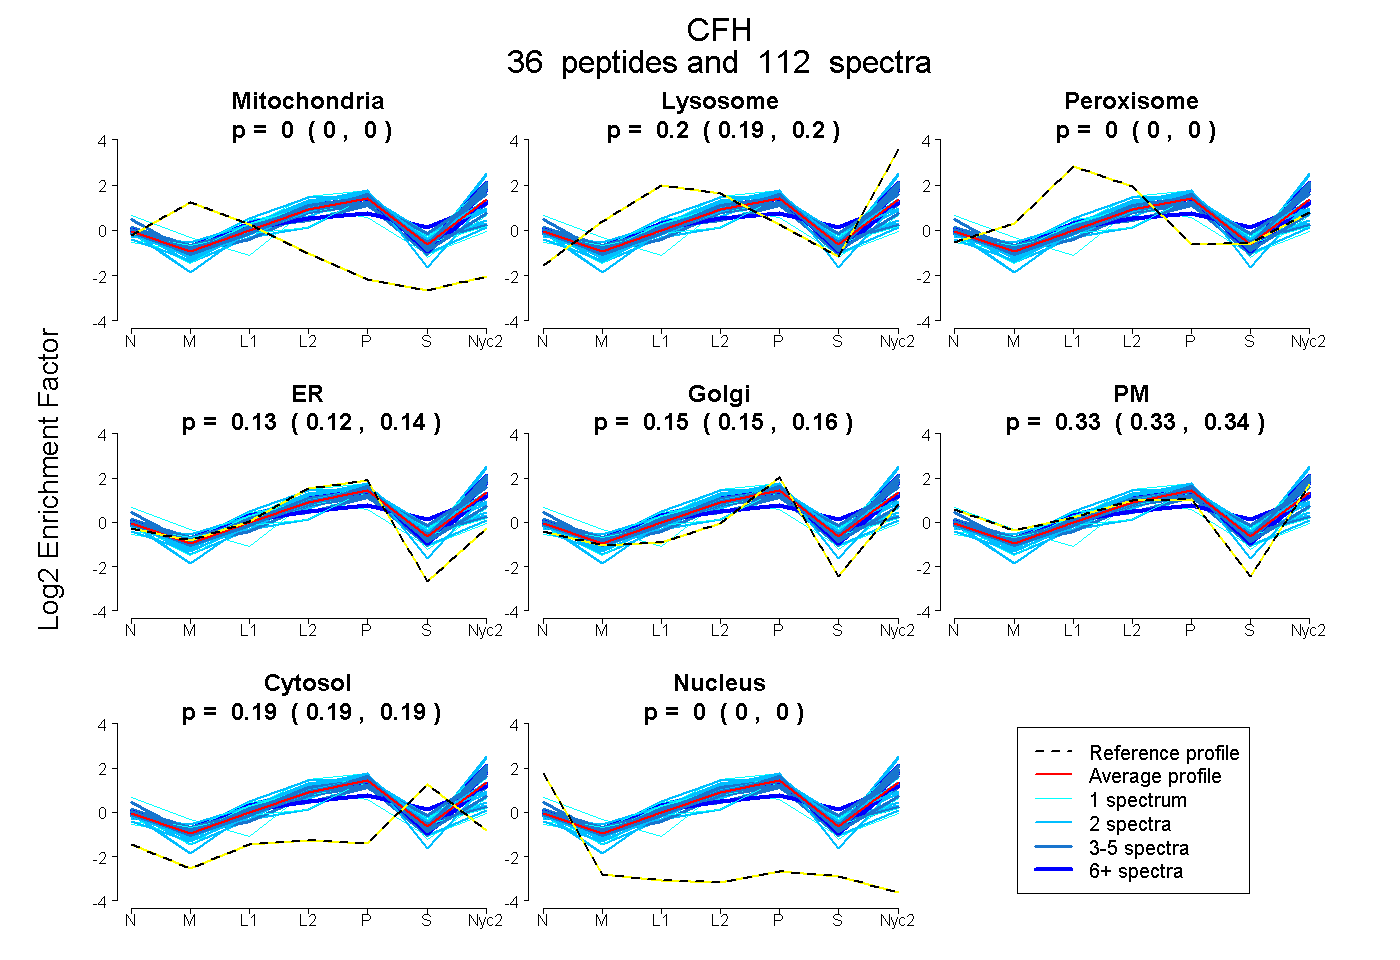
| Expt A |
36 peptides |
112 spectra |
|
0.000 0.000 | 0.000 |
0.197 0.194 | 0.200 |
0.000 0.000 | 0.000 |
0.130 0.122 | 0.137 |
0.151 0.145 | 0.157 |
0.334 0.329 | 0.338 |
0.188 0.185 | 0.189 |
0.000 0.000 | 0.000 |
| 2 spectra, QGFVYK | 0.000 | 0.298 | 0.000 | 0.000 | 0.312 | 0.265 | 0.126 | 0.000 | ||
| 2 spectra, ECDADGWTNDIPICEVVK | 0.000 | 0.000 | 0.260 | 0.335 | 0.079 | 0.072 | 0.253 | 0.000 | ||
| 1 spectrum, STGIDAIHPNK | 0.000 | 0.353 | 0.000 | 0.000 | 0.229 | 0.244 | 0.174 | 0.000 | ||
| 2 spectra, CLPVTELENGR | 0.000 | 0.127 | 0.000 | 0.289 | 0.049 | 0.280 | 0.255 | 0.000 | ||
| 4 spectra, VGDSLSFSCR | 0.000 | 0.052 | 0.140 | 0.180 | 0.385 | 0.113 | 0.130 | 0.000 | ||
| 1 spectrum, IVSGAAEPDQEYYFGQVVR | 0.000 | 0.286 | 0.000 | 0.000 | 0.317 | 0.210 | 0.188 | 0.000 | ||
| 1 spectrum, CRPGYR | 0.028 | 0.000 | 0.000 | 0.275 | 0.000 | 0.435 | 0.208 | 0.054 | ||
| 2 spectra, DNSCVNPPHVPNATILTR | 0.000 | 0.348 | 0.000 | 0.000 | 0.146 | 0.469 | 0.037 | 0.000 | ||
| 1 spectrum, VEYSHGDVVEYDCKPR | 0.000 | 0.357 | 0.000 | 0.272 | 0.177 | 0.000 | 0.195 | 0.000 | ||
| 2 spectra, MDGSDIVTCVNTK | 0.000 | 0.249 | 0.000 | 0.349 | 0.238 | 0.152 | 0.013 | 0.000 | ||
| 2 spectra, NGFYPATR | 0.000 | 0.329 | 0.000 | 0.000 | 0.231 | 0.370 | 0.070 | 0.000 | ||
| 2 spectra, WTTLPICVEYER | 0.000 | 0.226 | 0.000 | 0.147 | 0.208 | 0.214 | 0.206 | 0.000 | ||
| 2 spectra, LAVGSEFEFGAK | 0.000 | 0.176 | 0.000 | 0.000 | 0.312 | 0.339 | 0.173 | 0.000 | ||
| 7 spectra, RPYFPVPIGK | 0.000 | 0.226 | 0.000 | 0.027 | 0.214 | 0.403 | 0.131 | 0.000 | ||
| 4 spectra, YIEGQSAK | 0.000 | 0.293 | 0.000 | 0.000 | 0.269 | 0.313 | 0.126 | 0.000 | ||
| 5 spectra, WQSLPR | 0.000 | 0.261 | 0.000 | 0.000 | 0.196 | 0.429 | 0.114 | 0.000 | ||
| 5 spectra, ECSIPLLHQDLVVFPR | 0.000 | 0.145 | 0.084 | 0.102 | 0.280 | 0.210 | 0.179 | 0.000 | ||
| 1 spectrum, SCDMPVFENAMTK | 0.000 | 0.385 | 0.056 | 0.000 | 0.328 | 0.069 | 0.162 | 0.000 | ||
| 2 spectra, FECNSGFK | 0.000 | 0.000 | 0.110 | 0.565 | 0.076 | 0.097 | 0.153 | 0.000 | ||
| 3 spectra, WIGQPVCK | 0.000 | 0.238 | 0.000 | 0.000 | 0.209 | 0.402 | 0.151 | 0.000 | ||
| 5 spectra, TLGTIVK | 0.000 | 0.229 | 0.000 | 0.003 | 0.201 | 0.437 | 0.130 | 0.000 | ||
| 4 spectra, WSSLPR | 0.000 | 0.262 | 0.000 | 0.025 | 0.151 | 0.313 | 0.249 | 0.000 | ||
| 2 spectra, CIEGHINYPTCV | 0.000 | 0.006 | 0.120 | 0.299 | 0.256 | 0.031 | 0.288 | 0.000 | ||
| 5 spectra, YLDGEK | 0.000 | 0.226 | 0.000 | 0.000 | 0.221 | 0.384 | 0.169 | 0.000 | ||
| 1 spectrum, IPCSQPPK | 0.000 | 0.176 | 0.025 | 0.000 | 0.139 | 0.458 | 0.203 | 0.000 | ||
| 2 spectra, CTITGWIPAPR | 0.000 | 0.287 | 0.000 | 0.196 | 0.161 | 0.265 | 0.092 | 0.000 | ||
| 4 spectra, LSEENR | 0.000 | 0.000 | 0.220 | 0.155 | 0.249 | 0.149 | 0.227 | 0.000 | ||
| 2 spectra, VTCNMGK | 0.000 | 0.240 | 0.000 | 0.264 | 0.214 | 0.013 | 0.270 | 0.000 | ||
| 1 spectrum, VGADLVQCYHFGWSPNFPTCEGQVK | 0.000 | 0.000 | 0.202 | 0.072 | 0.527 | 0.000 | 0.199 | 0.000 | ||
| 2 spectra, CPPPYR | 0.000 | 0.000 | 0.098 | 0.055 | 0.444 | 0.129 | 0.275 | 0.000 | ||
| 1 spectrum, CTVNGWEPEVPCLR | 0.000 | 0.104 | 0.018 | 0.572 | 0.000 | 0.189 | 0.117 | 0.000 | ||
| 7 spectra, IQCVDGK | 0.000 | 0.202 | 0.000 | 0.169 | 0.227 | 0.261 | 0.140 | 0.000 | ||
| 2 spectra, SCDQPLEIPNGEIK | 0.000 | 0.202 | 0.000 | 0.092 | 0.226 | 0.305 | 0.175 | 0.000 | ||
| 12 spectra, LYYEESR | 0.000 | 0.337 | 0.000 | 0.000 | 0.199 | 0.342 | 0.122 | 0.000 | ||
| 6 spectra, SGEQVTFR | 0.000 | 0.140 | 0.072 | 0.000 | 0.000 | 0.444 | 0.345 | 0.000 | ||
| 5 spectra, HNIVLR | 0.000 | 0.059 | 0.000 | 0.000 | 0.056 | 0.722 | 0.162 | 0.000 |
| Plot | Mito | Lyso or Perox | ER | Golgi | PM | Cytosol | Nucleus | ||||||
| Expt B |
15 peptides |
27 spectra |
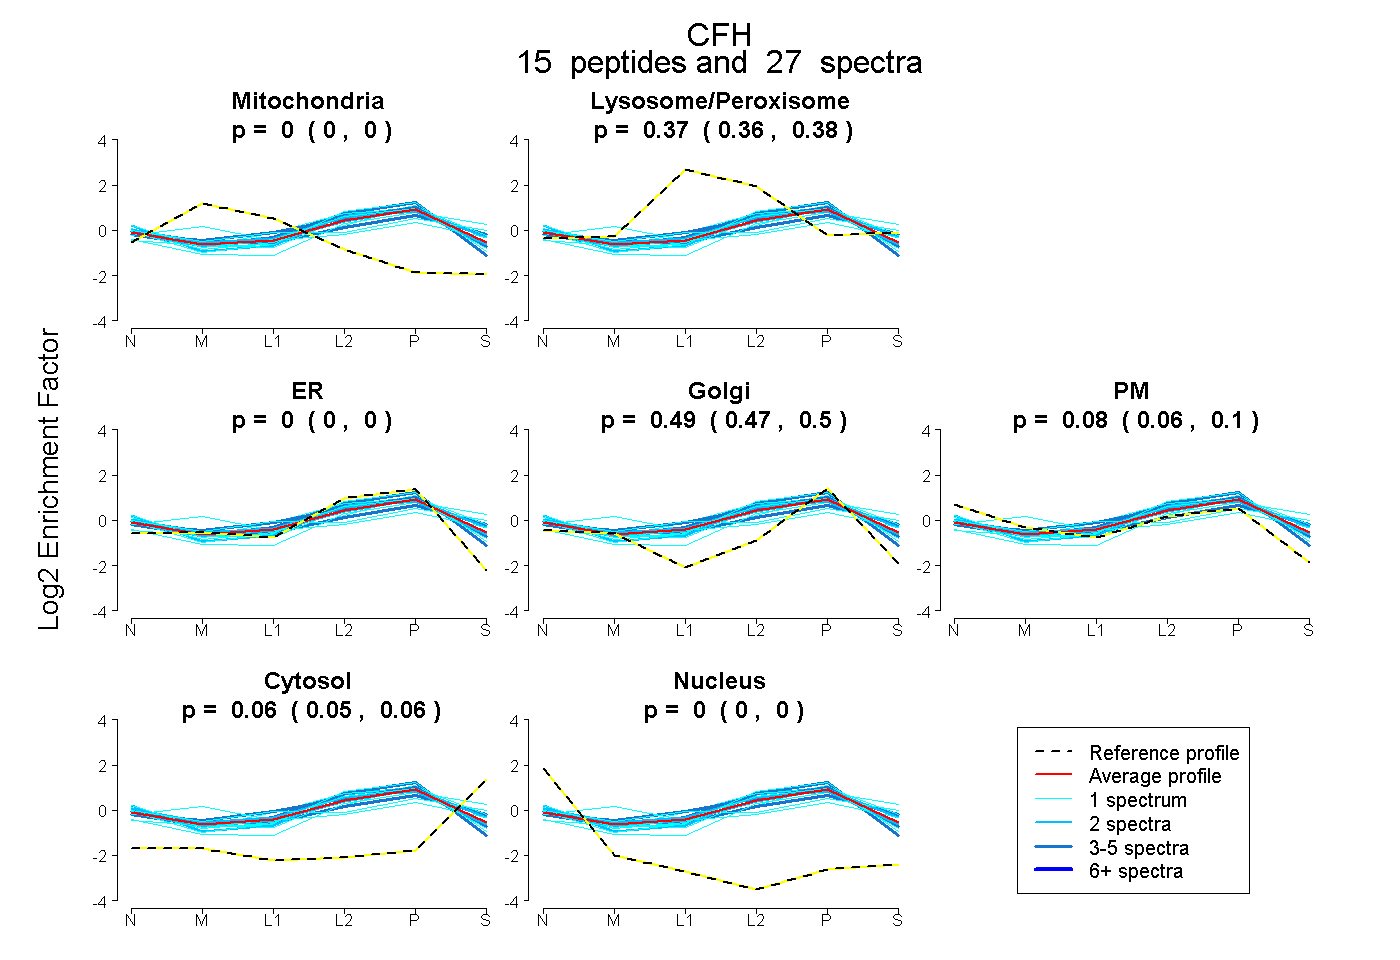 |
0.000 0.000 | 0.000 |
0.372 0.365 | 0.378 |
0.000 0.000 | 0.000 |
0.488 0.473 | 0.500 |
0.081 0.063 | 0.096 |
0.059 0.053 | 0.064 |
0.000 0.000 | 0.000 |
|||
| Plot | Lyso | Other | |||||||||||
| Expt C |
41 peptides |
247 spectra |
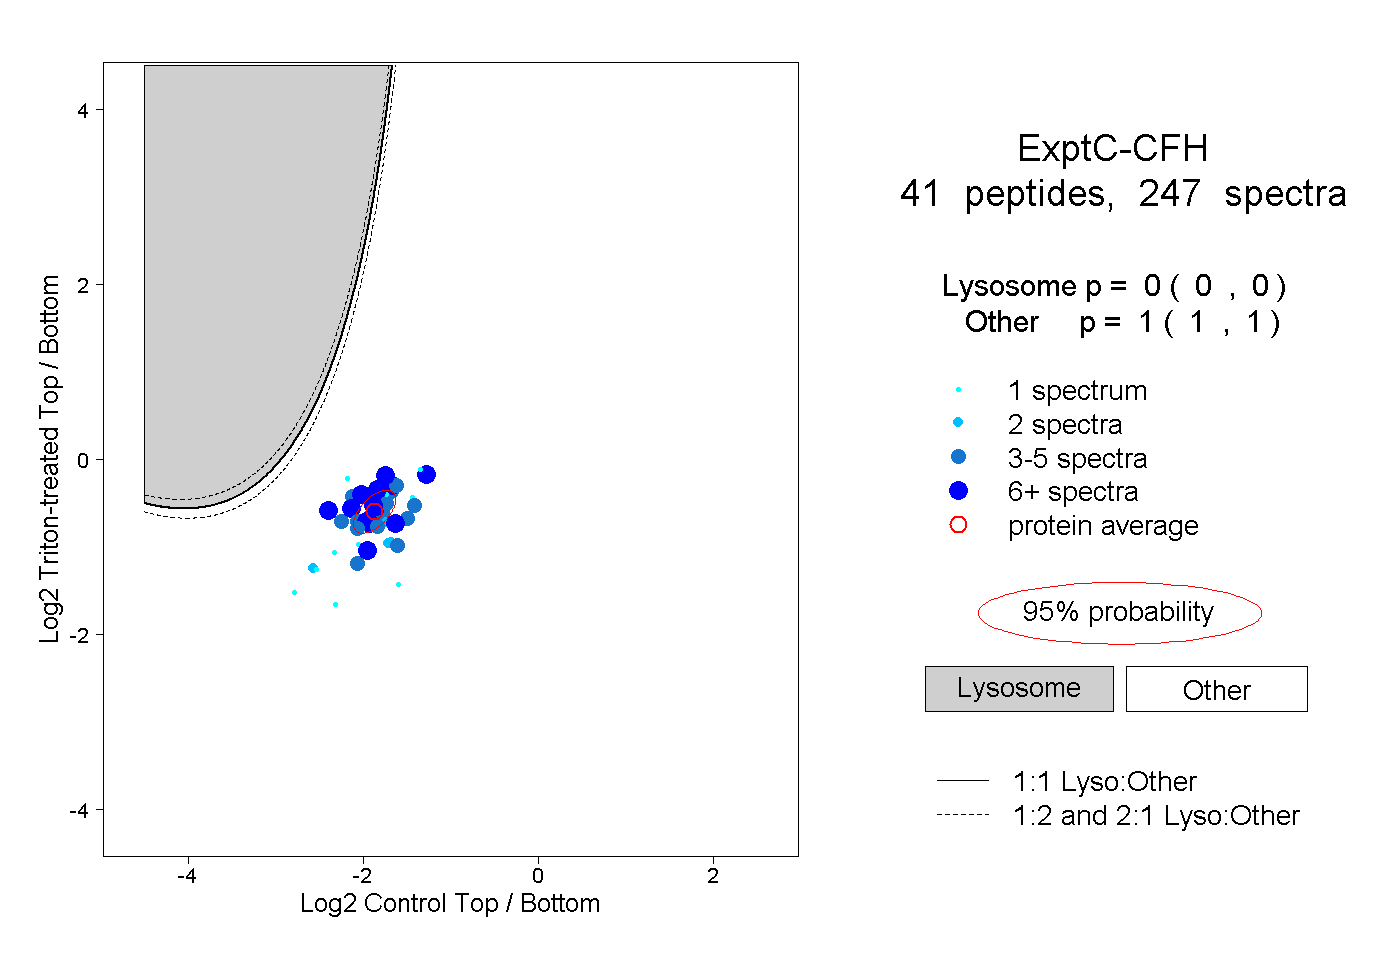 |
0.000 0.000 | 0.000 |
1.000 1.000 | 1.000 |
||||||||
| Plot | Lyso | Other | |||||||||||
| Expt D |
15 peptides |
45 spectra |
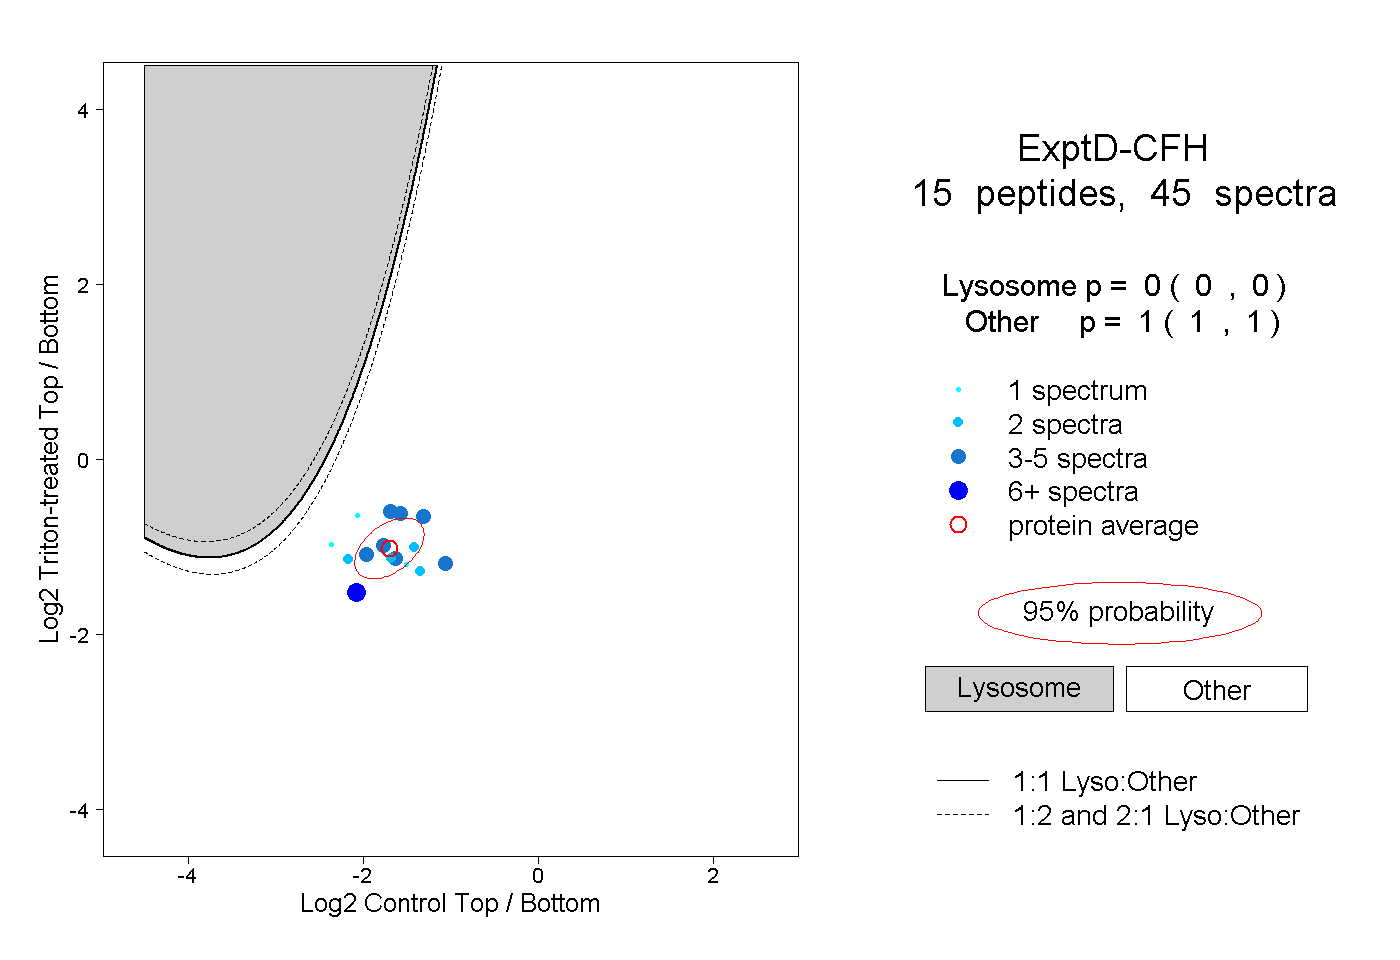 |
0.000 0.000 | 0.000 |
1.000 1.000 | 1.000 |