 7
7peptides
spectra
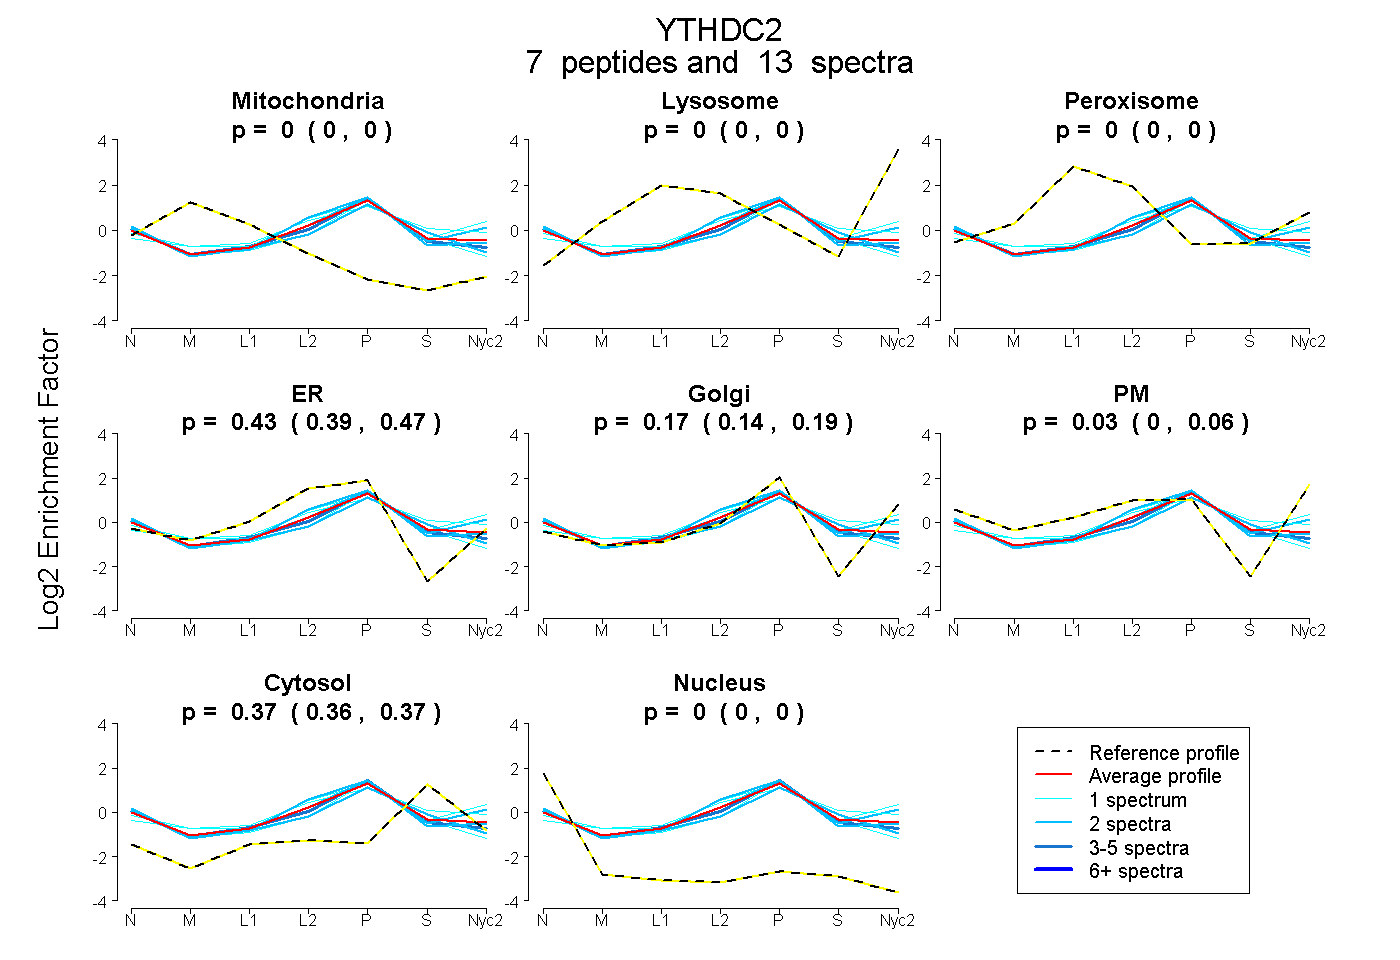
0.000 | 0.000
0.000 | 0.000
0.000 | 0.000
0.387 | 0.470
0.136 | 0.194
0.000 | 0.062
0.358 | 0.374
0.000 | 0.000
1peptide
spectra
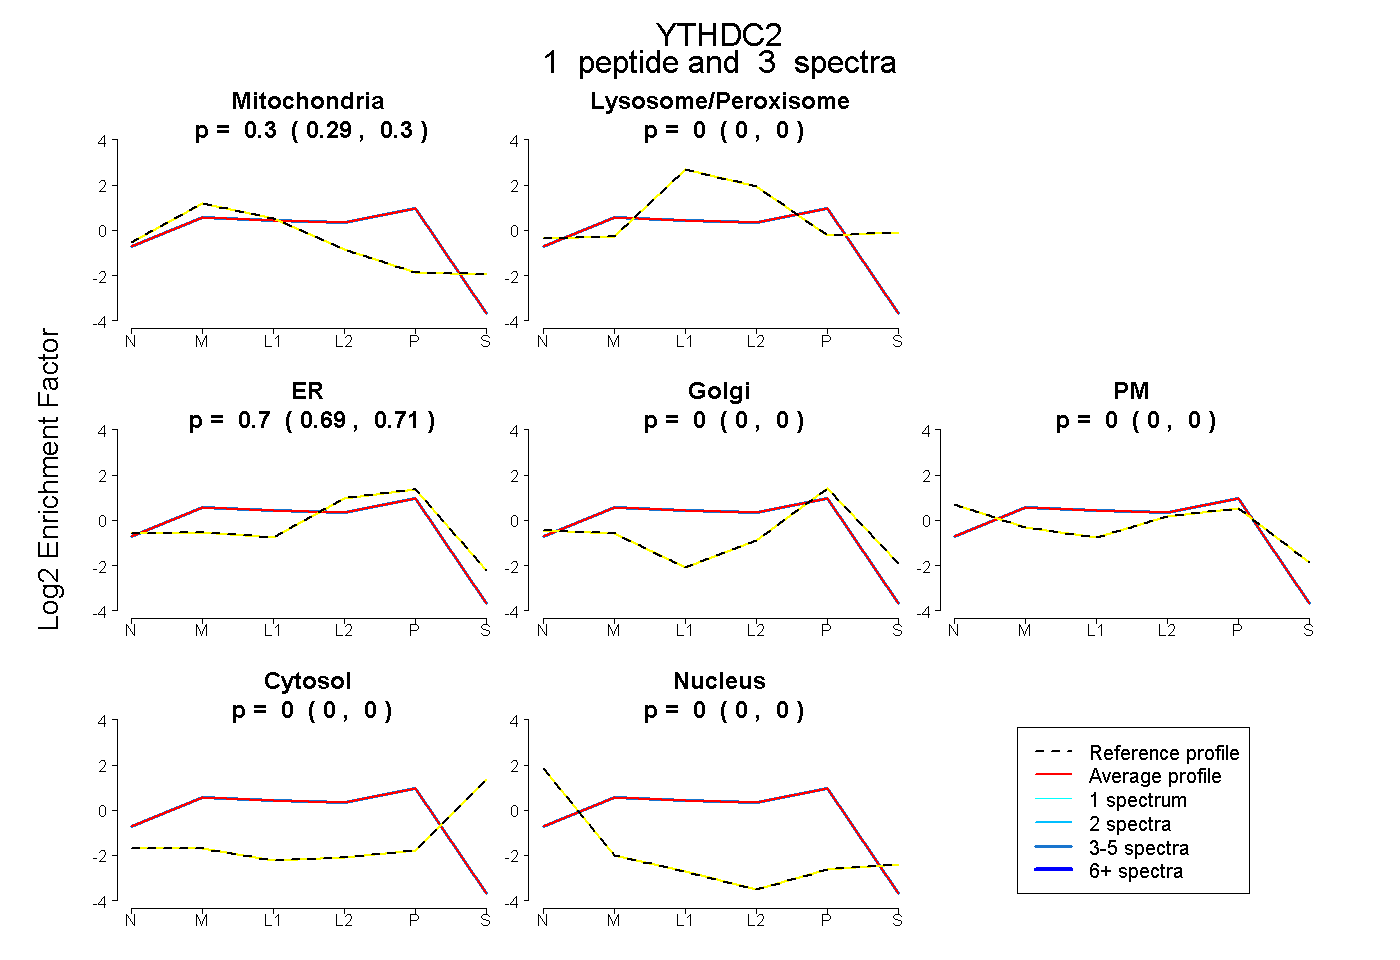
0.286 | 0.305
0.000 | 0.000
0.694 | 0.712
0.000 | 0.000
0.000 | 0.000
0.000 | 0.000
0.000 | 0.000
6peptides
spectra
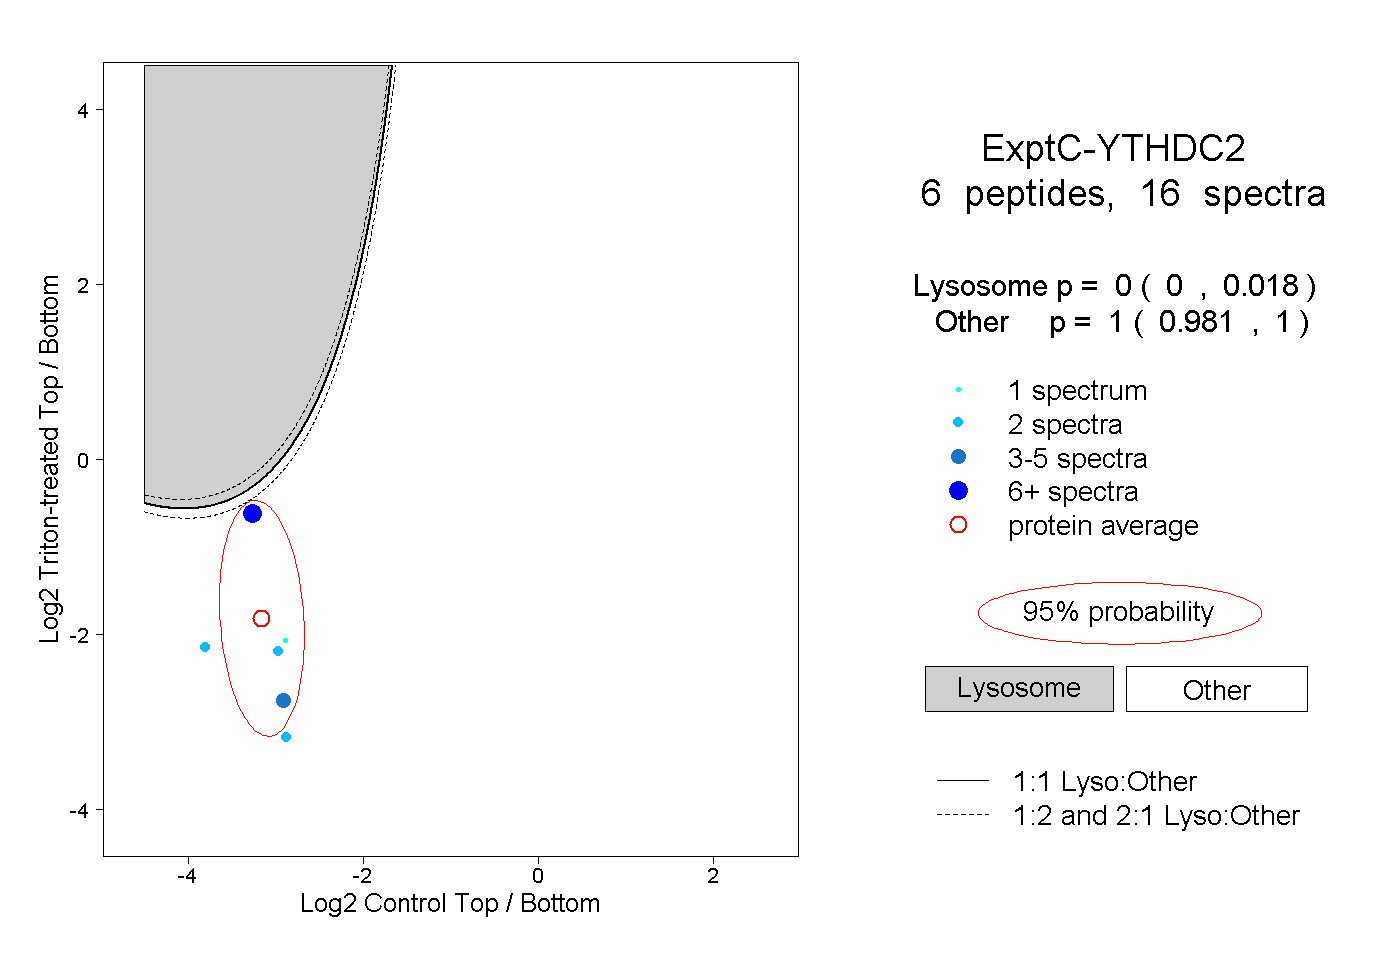
0.000 | 0.018
0.981 | 1.000
3peptides
spectra
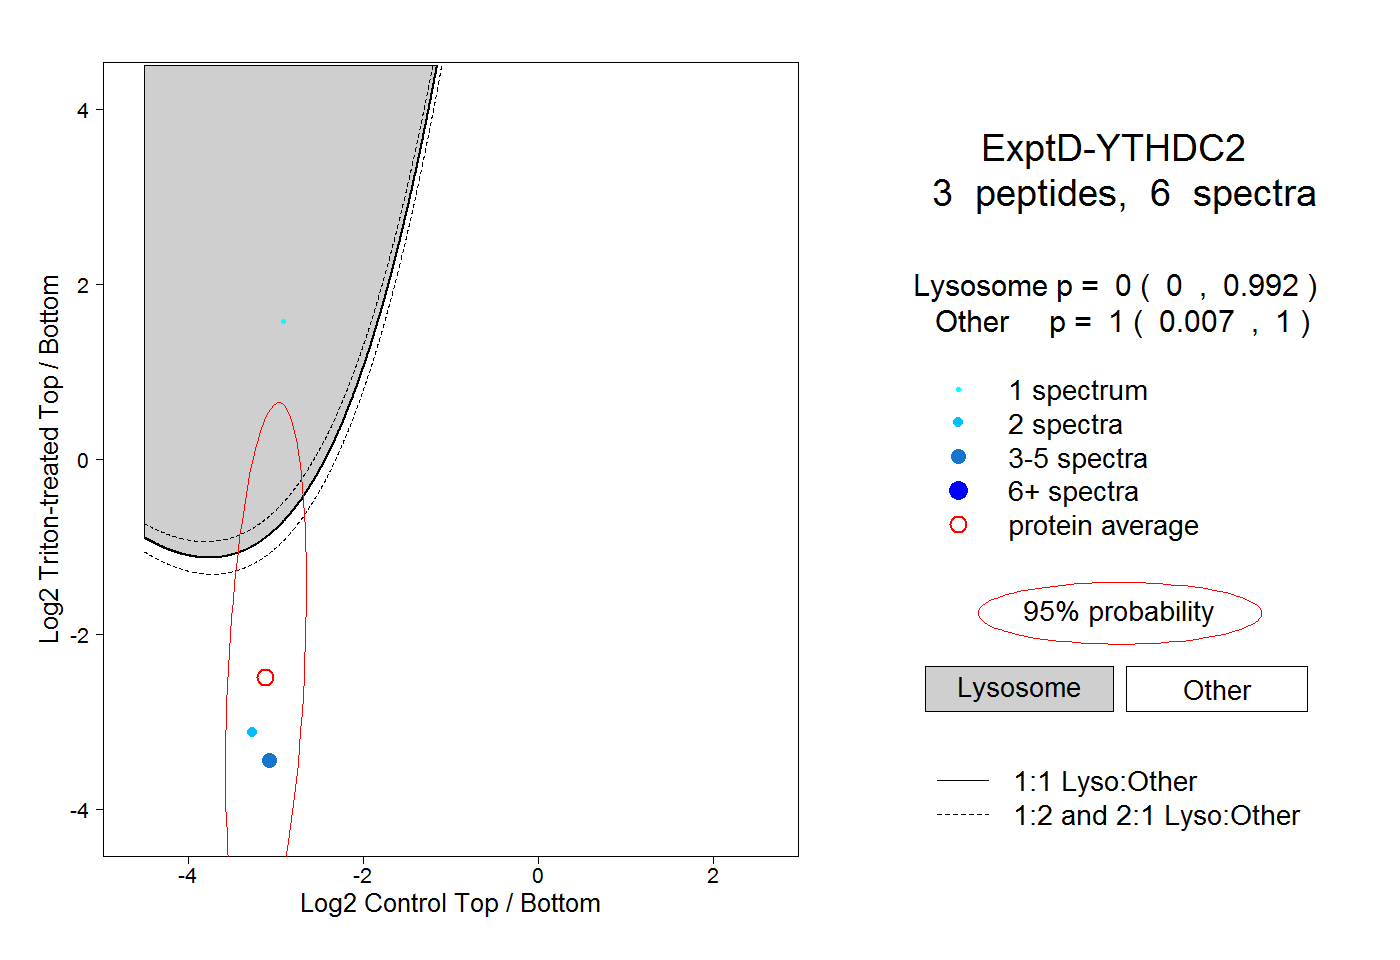
0.000 | 0.992
0.007 | 1.000