 7
7peptides
spectra
0.000 | 0.000
0.000 | 0.000
0.000 | 0.000
0.387 | 0.470
0.136 | 0.194
0.000 | 0.062
0.358 | 0.374
0.000 | 0.000
| Plot | Mito | Lyso | Perox | ER | Golgi | PM | Cytosol | Nucleus | |||||
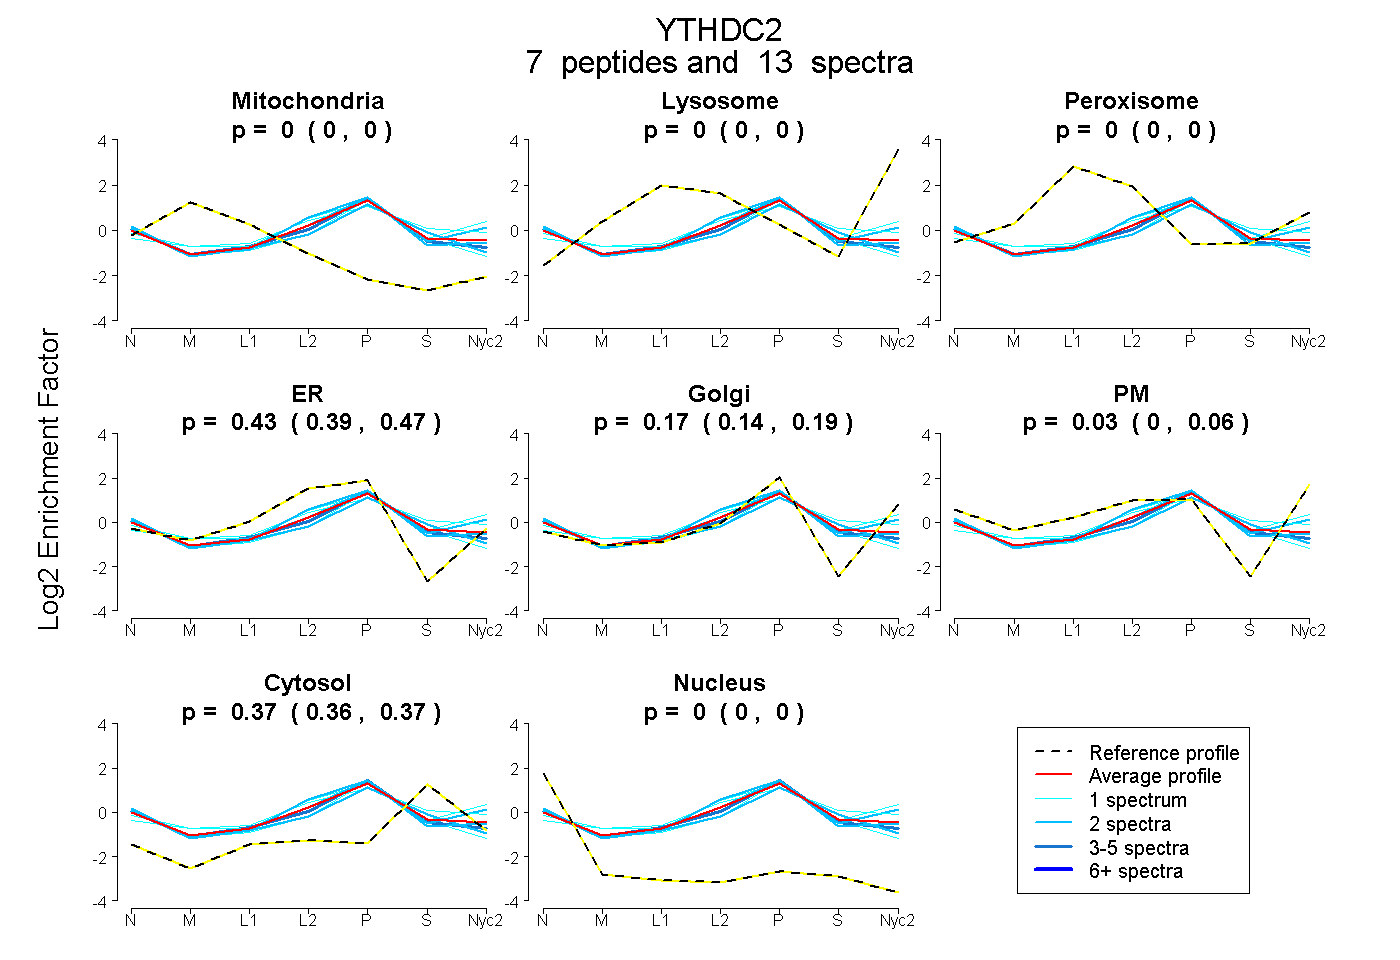
| Expt A |
7 peptides |
13 spectra |
|
0.000 0.000 | 0.000 |
0.000 0.000 | 0.000 |
0.000 0.000 | 0.000 |
0.433 0.387 | 0.470 |
0.168 0.136 | 0.194 |
0.032 0.000 | 0.062 |
0.367 0.358 | 0.374 |
0.000 0.000 | 0.000 |
| 2 spectra, WHSLFLR | 0.000 | 0.000 | 0.000 | 0.570 | 0.105 | 0.012 | 0.314 | 0.000 | ||
| 2 spectra, TTGYTNK | 0.000 | 0.000 | 0.000 | 0.437 | 0.104 | 0.000 | 0.433 | 0.026 | ||
| 2 spectra, LTSNALQEPSSFR | 0.000 | 0.000 | 0.000 | 0.238 | 0.294 | 0.159 | 0.308 | 0.000 | ||
| 4 spectra, GESEFDSFR | 0.000 | 0.000 | 0.000 | 0.477 | 0.160 | 0.000 | 0.357 | 0.006 | ||
| 1 spectrum, APEPPPALIVR | 0.000 | 0.000 | 0.000 | 0.473 | 0.104 | 0.000 | 0.376 | 0.047 | ||
| 1 spectrum, LDEWLNFK | 0.000 | 0.000 | 0.079 | 0.162 | 0.292 | 0.189 | 0.278 | 0.000 | ||
| 1 spectrum, SFDALNFVTMLK | 0.000 | 0.000 | 0.158 | 0.240 | 0.252 | 0.000 | 0.350 | 0.000 |
| Plot | Mito | Lyso or Perox | ER | Golgi | PM | Cytosol | Nucleus | ||||||
| Expt B |
1 peptide |
3 spectra |
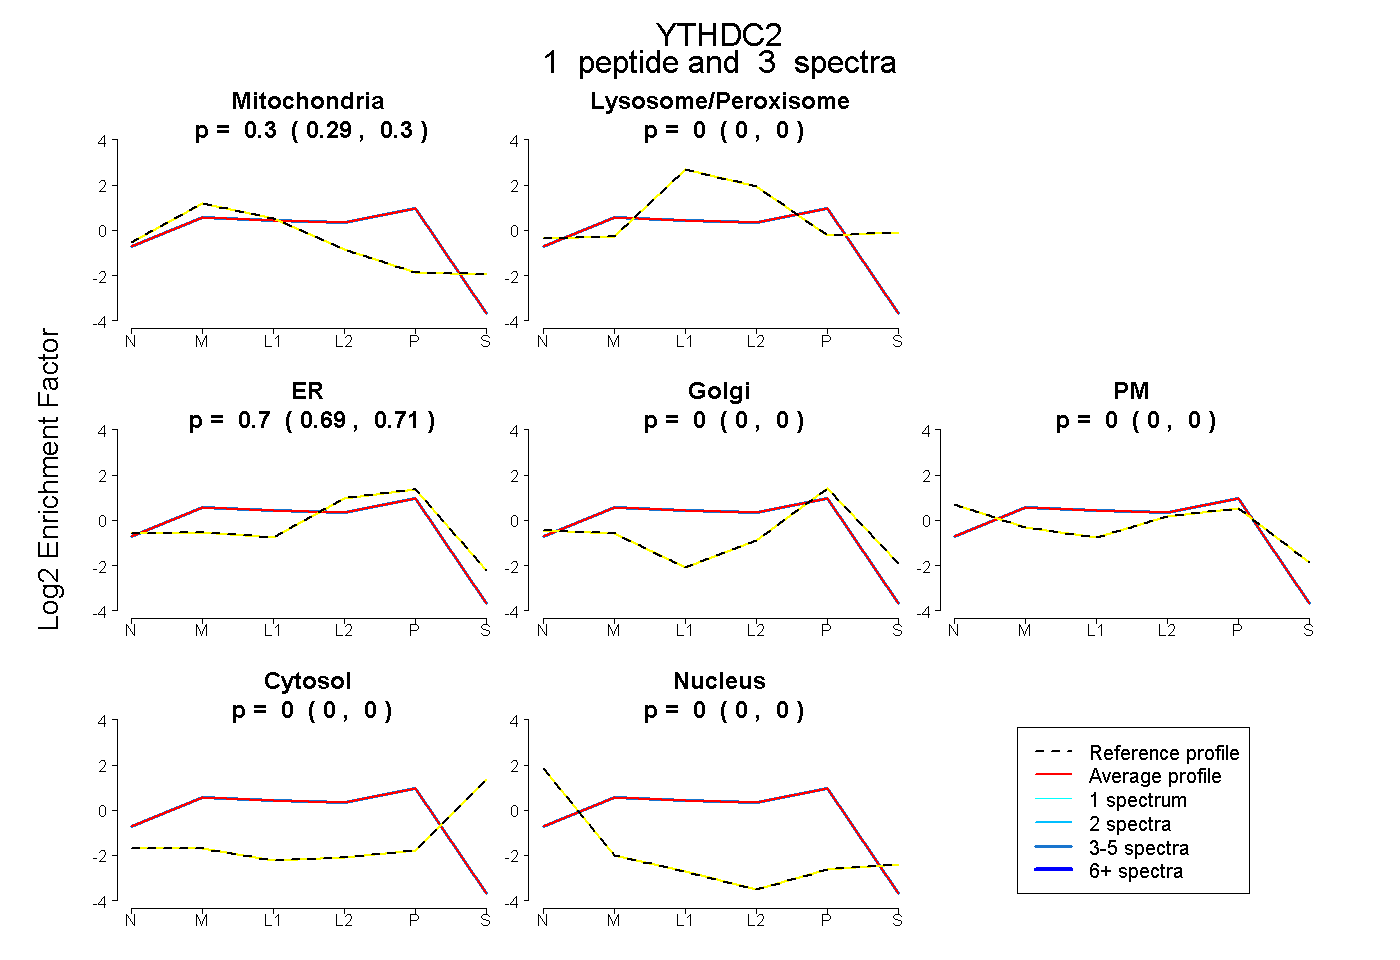 |
0.296 0.286 | 0.305 |
0.000 0.000 | 0.000 |
0.704 0.694 | 0.712 |
0.000 0.000 | 0.000 |
0.000 0.000 | 0.000 |
0.000 0.000 | 0.000 |
0.000 0.000 | 0.000 |
|||
| Plot | Lyso | Other | |||||||||||
| Expt C |
6 peptides |
16 spectra |
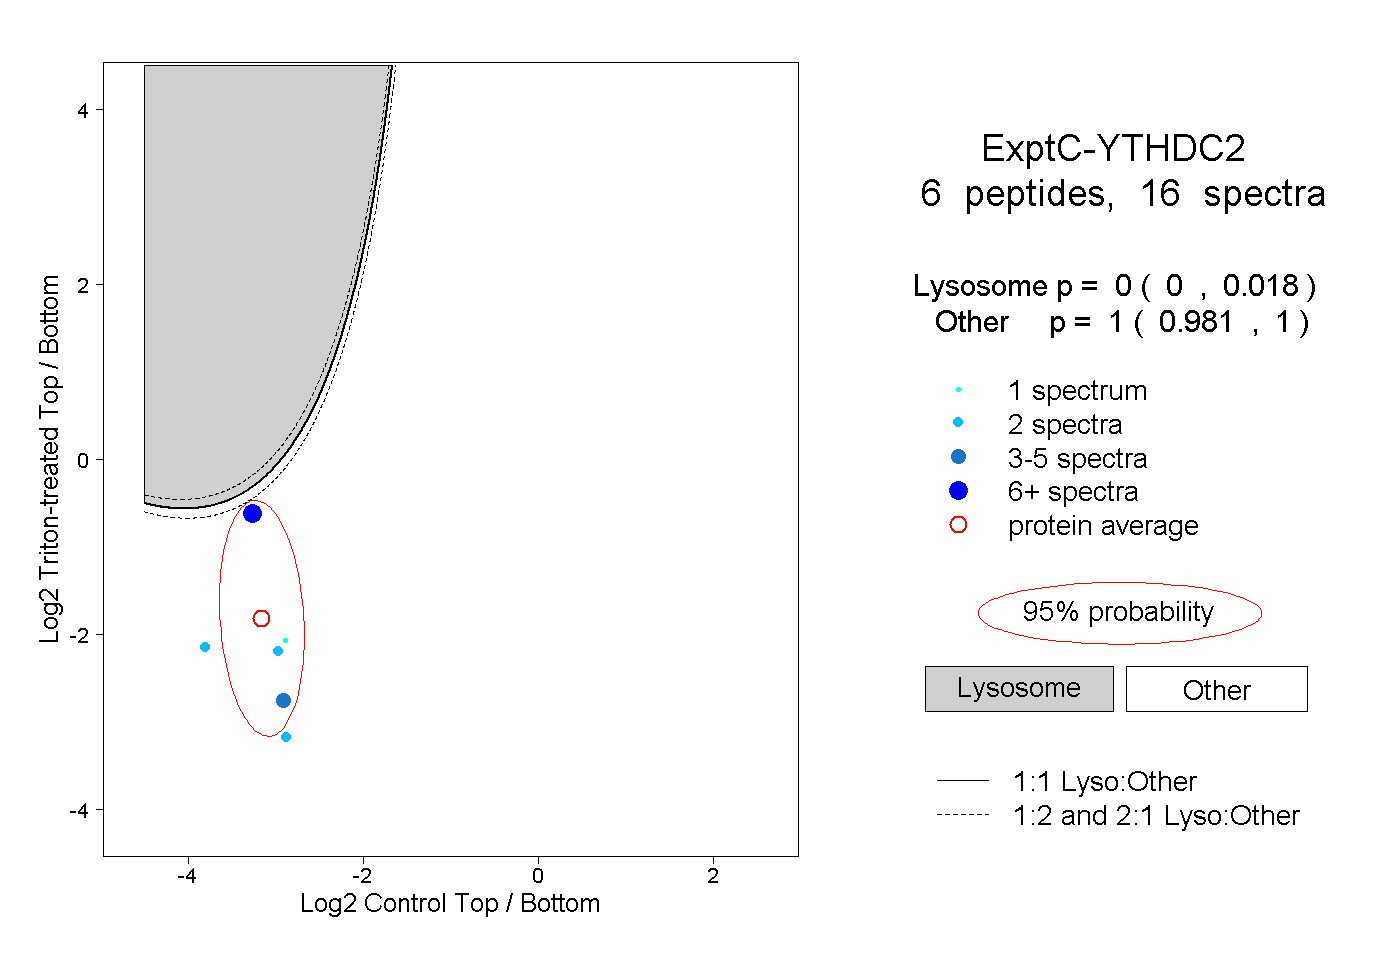 |
0.000 0.000 | 0.018 |
1.000 0.981 | 1.000 |
||||||||
| Plot | Lyso | Other | |||||||||||
| Expt D |
3 peptides |
6 spectra |
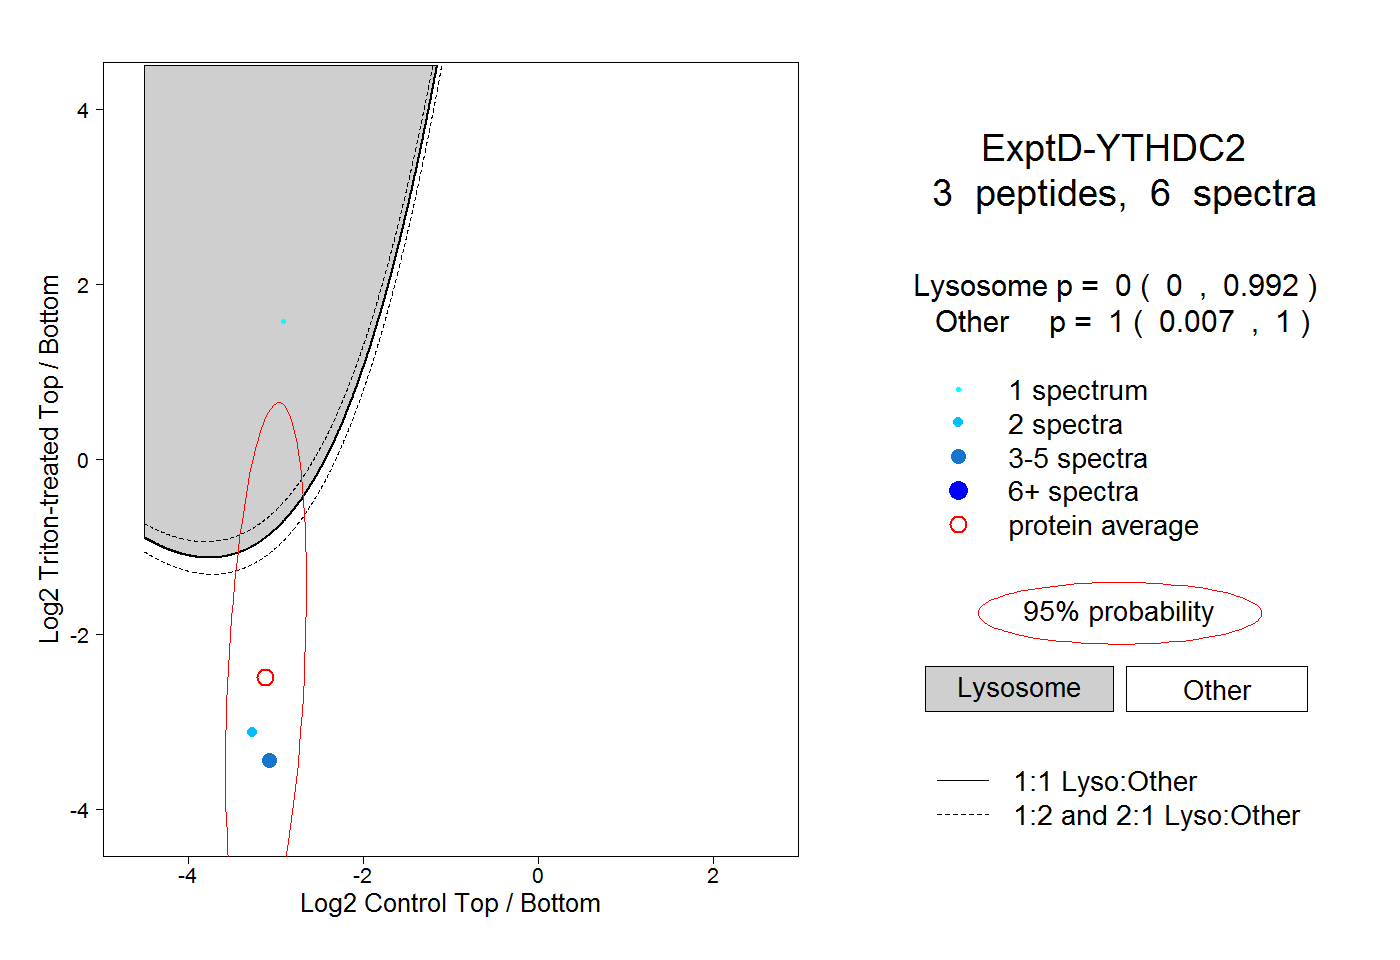 |
0.000 0.000 | 0.992 |
1.000 0.007 | 1.000 |