 2
2peptides
spectra
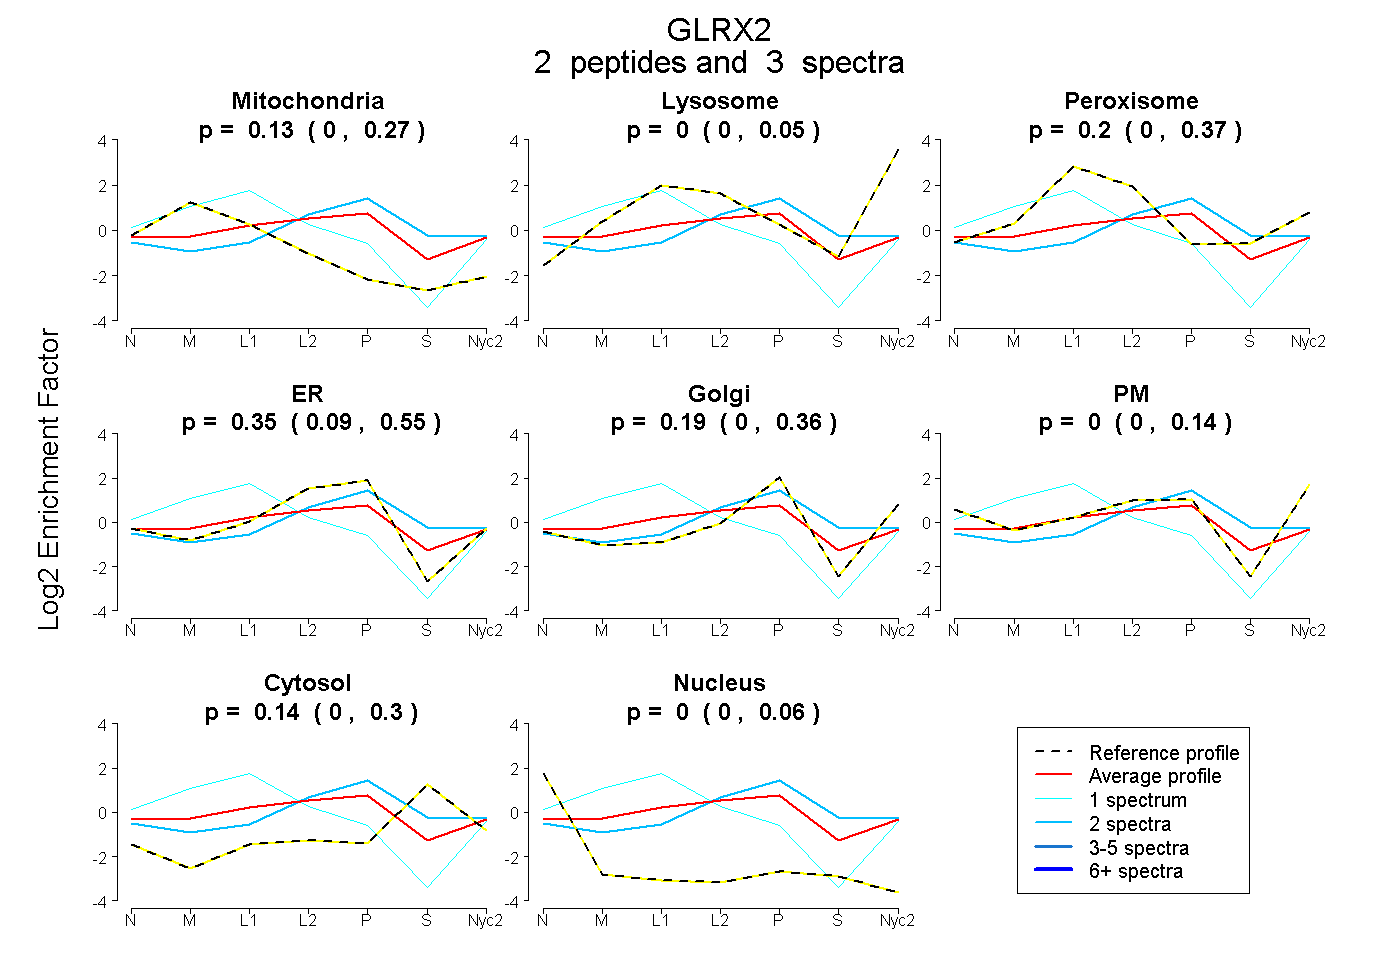
0.000 | 0.268
0.000 | 0.051
0.000 | 0.367
0.085 | 0.545
0.000 | 0.361
0.000 | 0.144
0.000 | 0.299
0.000 | 0.061
1peptide
spectrum
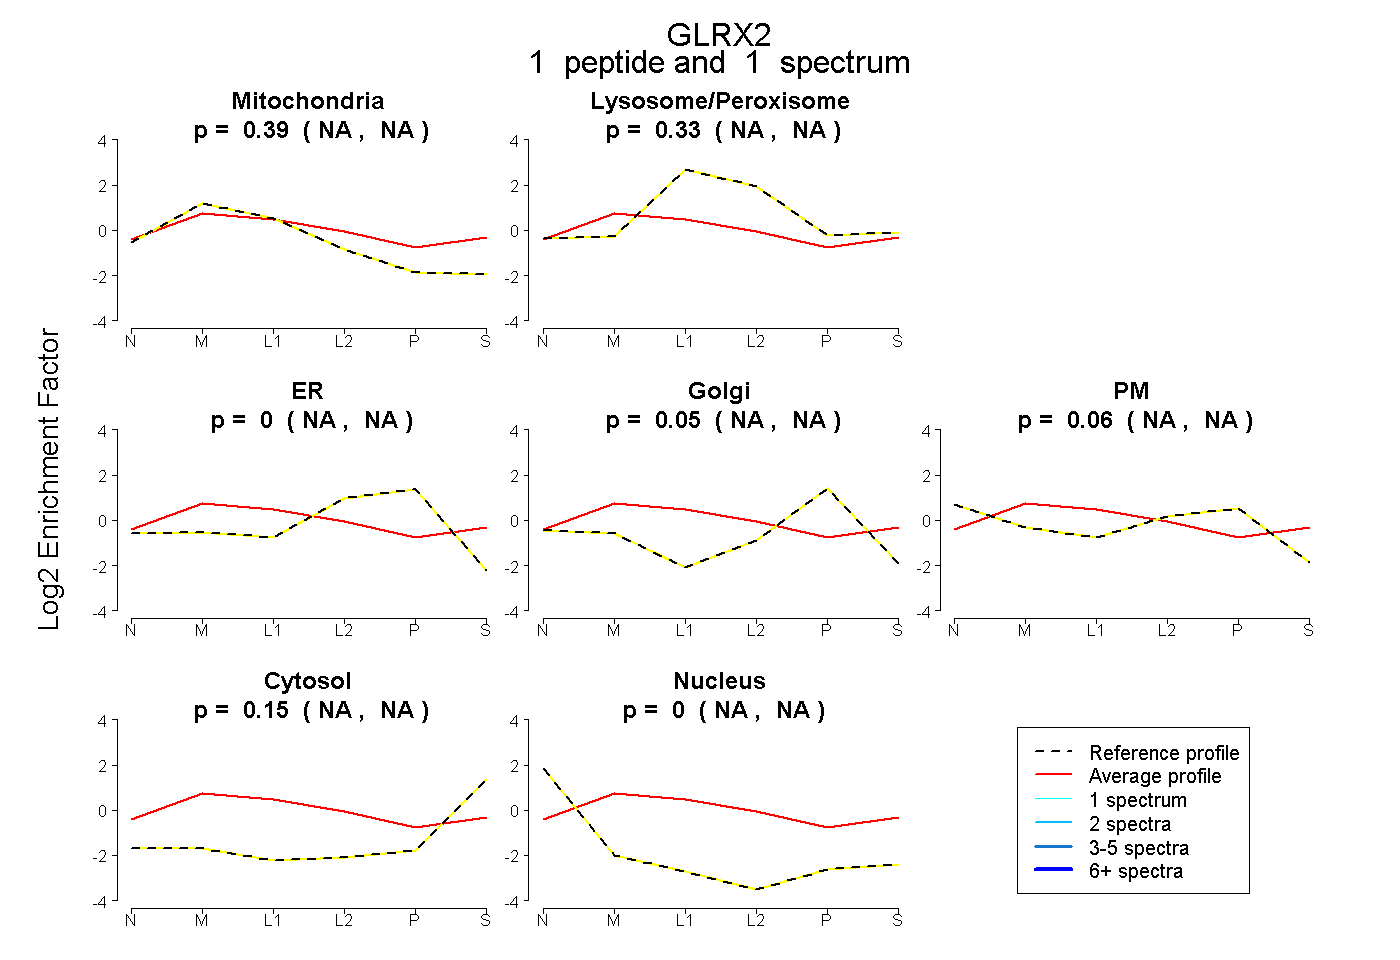
NA | NA
NA | NA
NA | NA
NA | NA
NA | NA
NA | NA
NA | NA
4peptides
spectra
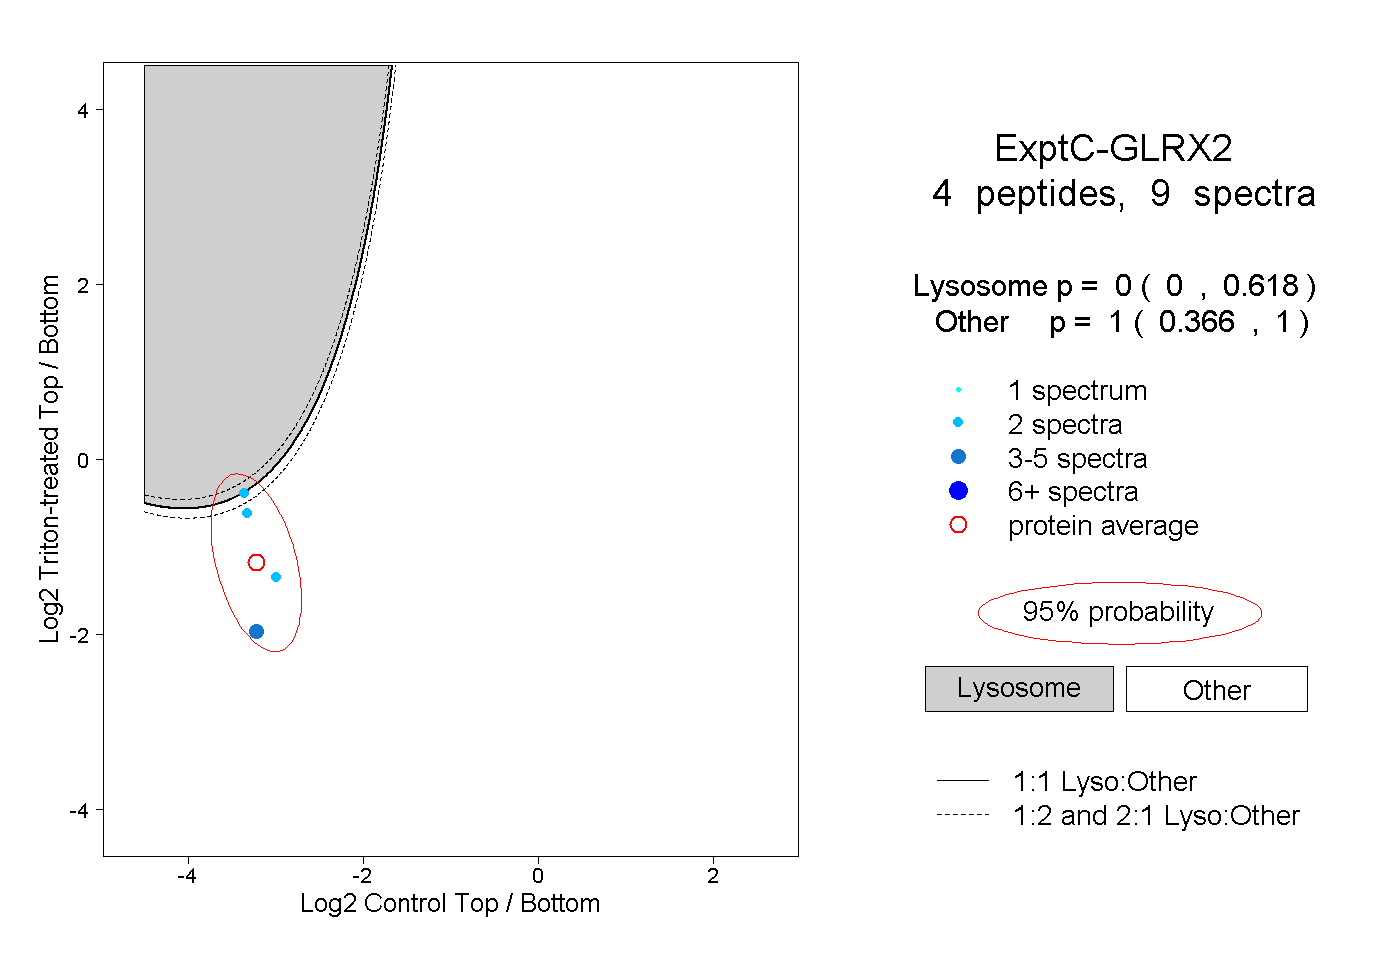
0.000 | 0.618
0.366 | 1.000