 2
2peptides
spectra
0.000 | 0.268
0.000 | 0.051
0.000 | 0.367
0.085 | 0.545
0.000 | 0.361
0.000 | 0.144
0.000 | 0.299
0.000 | 0.061
| Plot | Mito | Lyso | Perox | ER | Golgi | PM | Cytosol | Nucleus | |||||
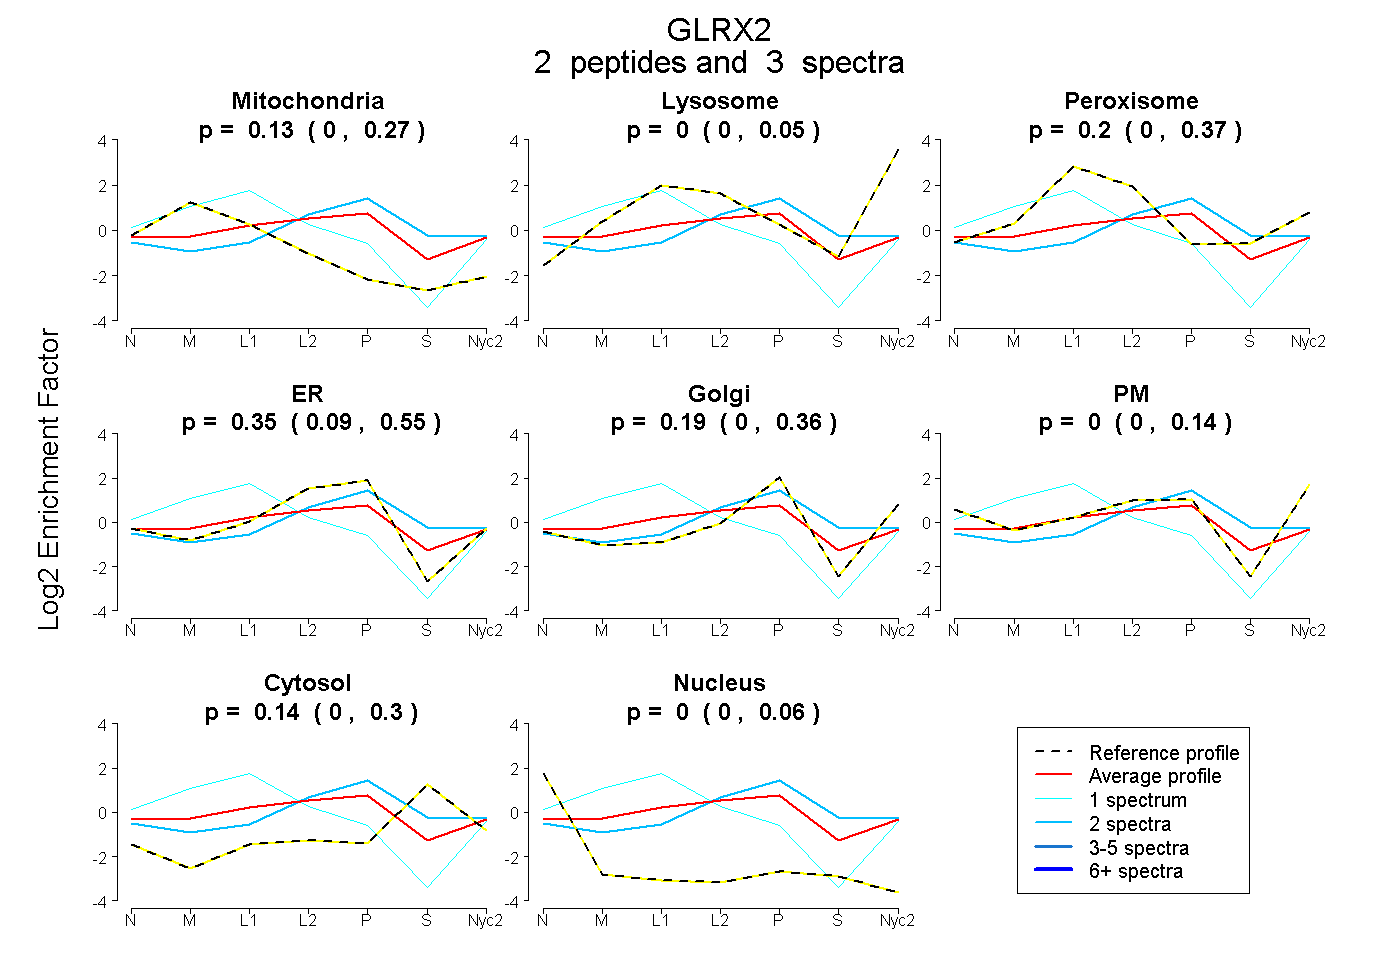
| Expt A |
2 peptides |
3 spectra |
|
0.126 0.000 | 0.268 |
0.000 0.000 | 0.051 |
0.205 0.000 | 0.367 |
0.347 0.085 | 0.545 |
0.186 0.000 | 0.361 |
0.000 0.000 | 0.144 |
0.137 0.000 | 0.299 |
0.000 0.000 | 0.061 |
| 1 spectrum, LLPLVHQCYLNK | 0.497 | 0.000 | 0.206 | 0.028 | 0.000 | 0.269 | 0.000 | 0.000 | ||
| 2 spectra, ILAGR | 0.000 | 0.015 | 0.053 | 0.503 | 0.093 | 0.000 | 0.336 | 0.000 |
| Plot | Mito | Lyso or Perox | ER | Golgi | PM | Cytosol | Nucleus | ||||||
| Expt B |
1 peptide |
1 spectrum |
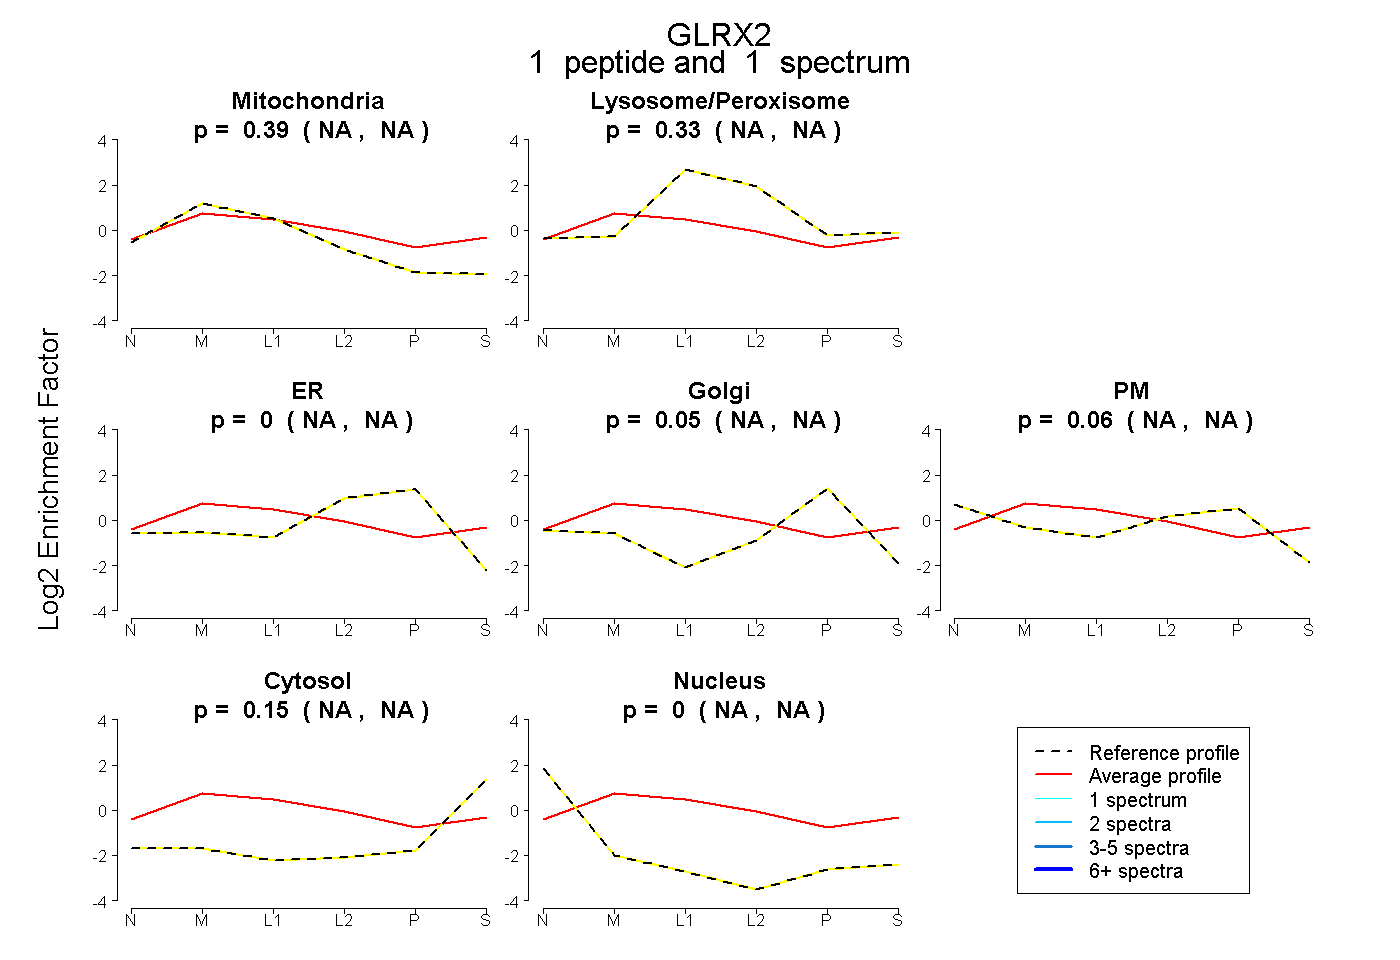 |
0.394 NA | NA |
0.335 NA | NA |
0.000 NA | NA |
0.054 NA | NA |
0.063 NA | NA |
0.154 NA | NA |
0.000 NA | NA |
|||
| Plot | Lyso | Other | |||||||||||
| Expt C |
4 peptides |
9 spectra |
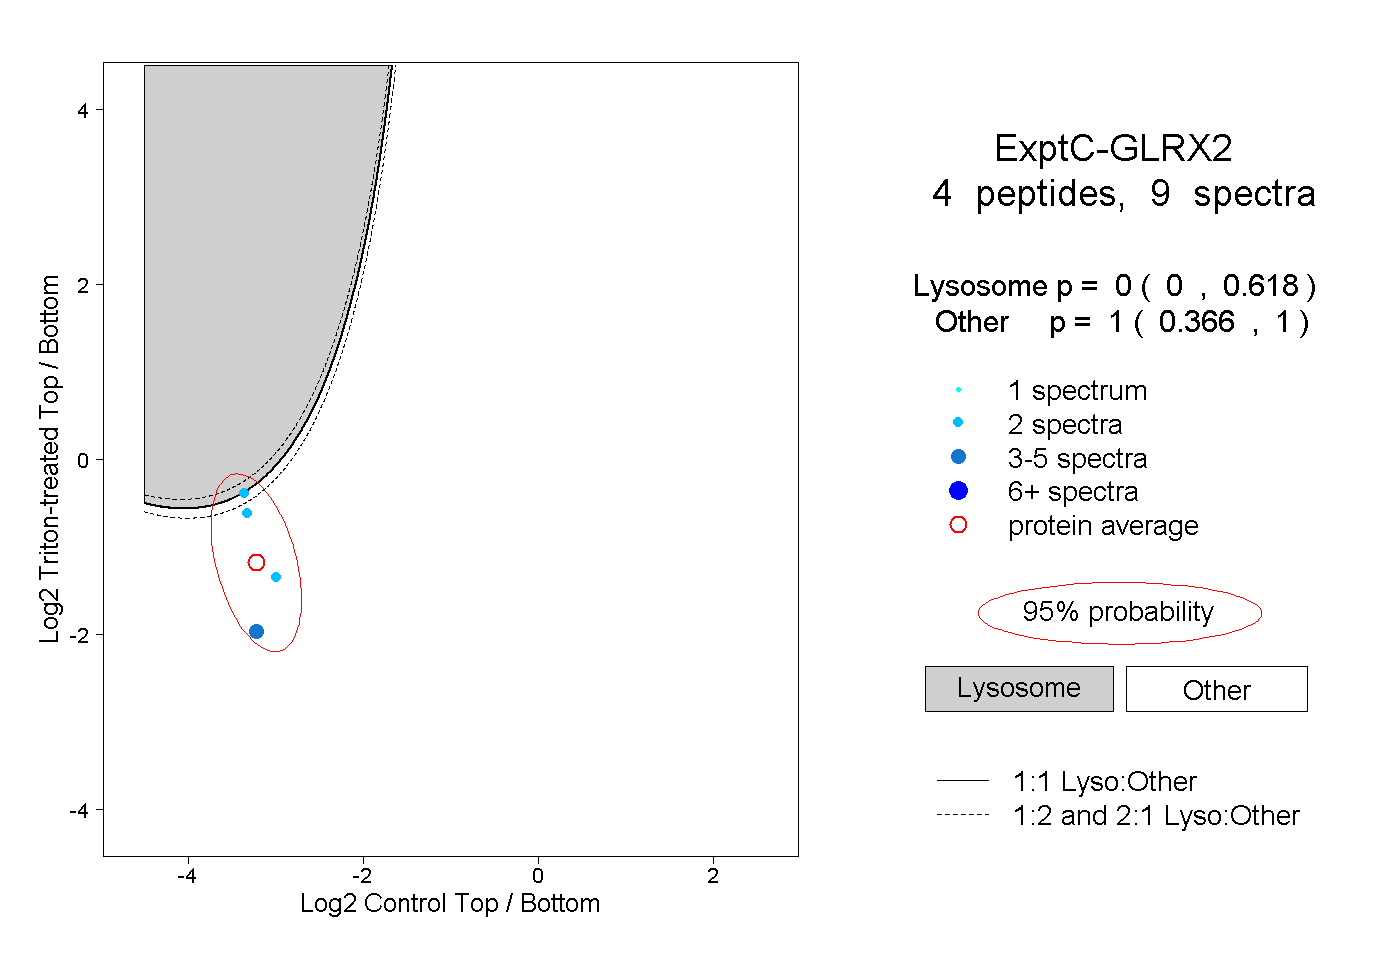 |
0.000 0.000 | 0.618 |
1.000 0.366 | 1.000 |