 2
2peptides
spectra
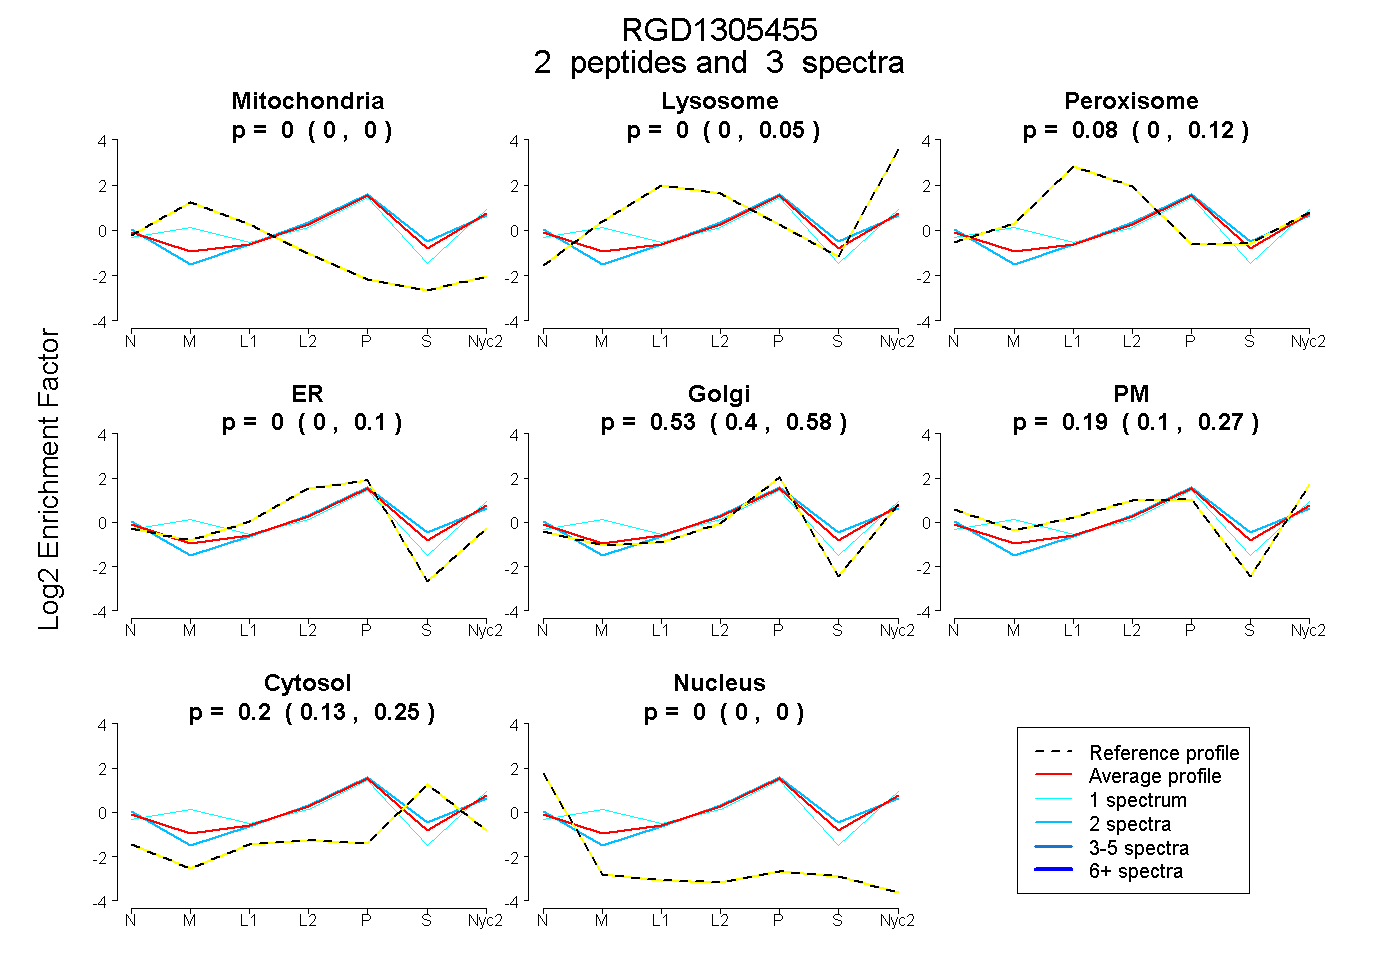
0.000 | 0.000
0.000 | 0.051
0.000 | 0.124
0.000 | 0.098
0.399 | 0.583
0.102 | 0.274
0.135 | 0.254
0.000 | 0.000
1peptide
spectrum
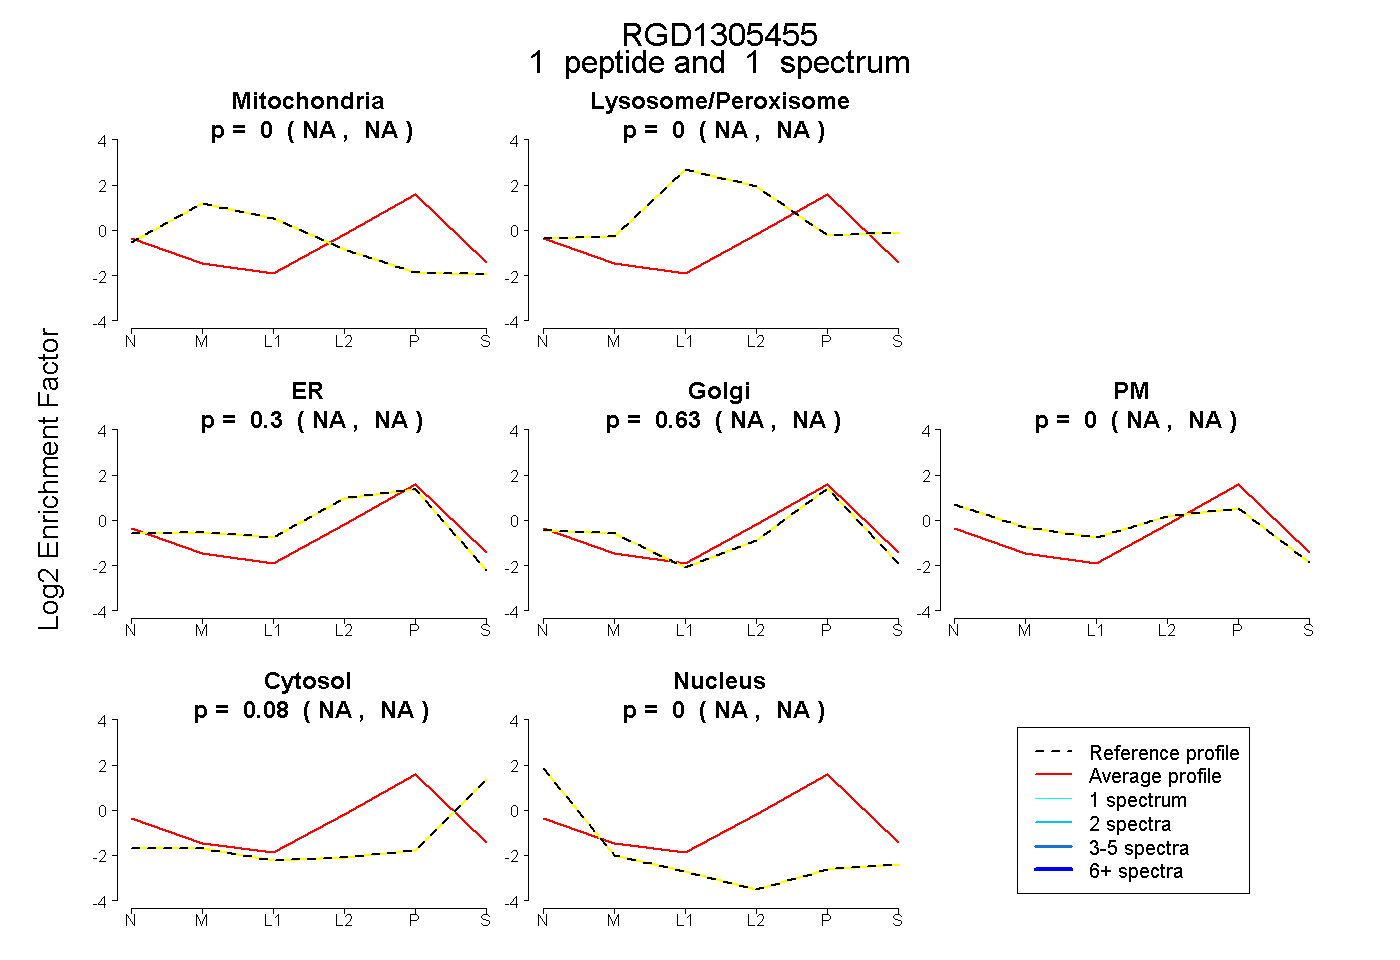
NA | NA
NA | NA
NA | NA
NA | NA
NA | NA
NA | NA
NA | NA
1peptide
spectrum

NA | NA
NA | NA