 2
2peptides
spectra
0.000 | 0.000
0.000 | 0.051
0.000 | 0.124
0.000 | 0.098
0.399 | 0.583
0.102 | 0.274
0.135 | 0.254
0.000 | 0.000
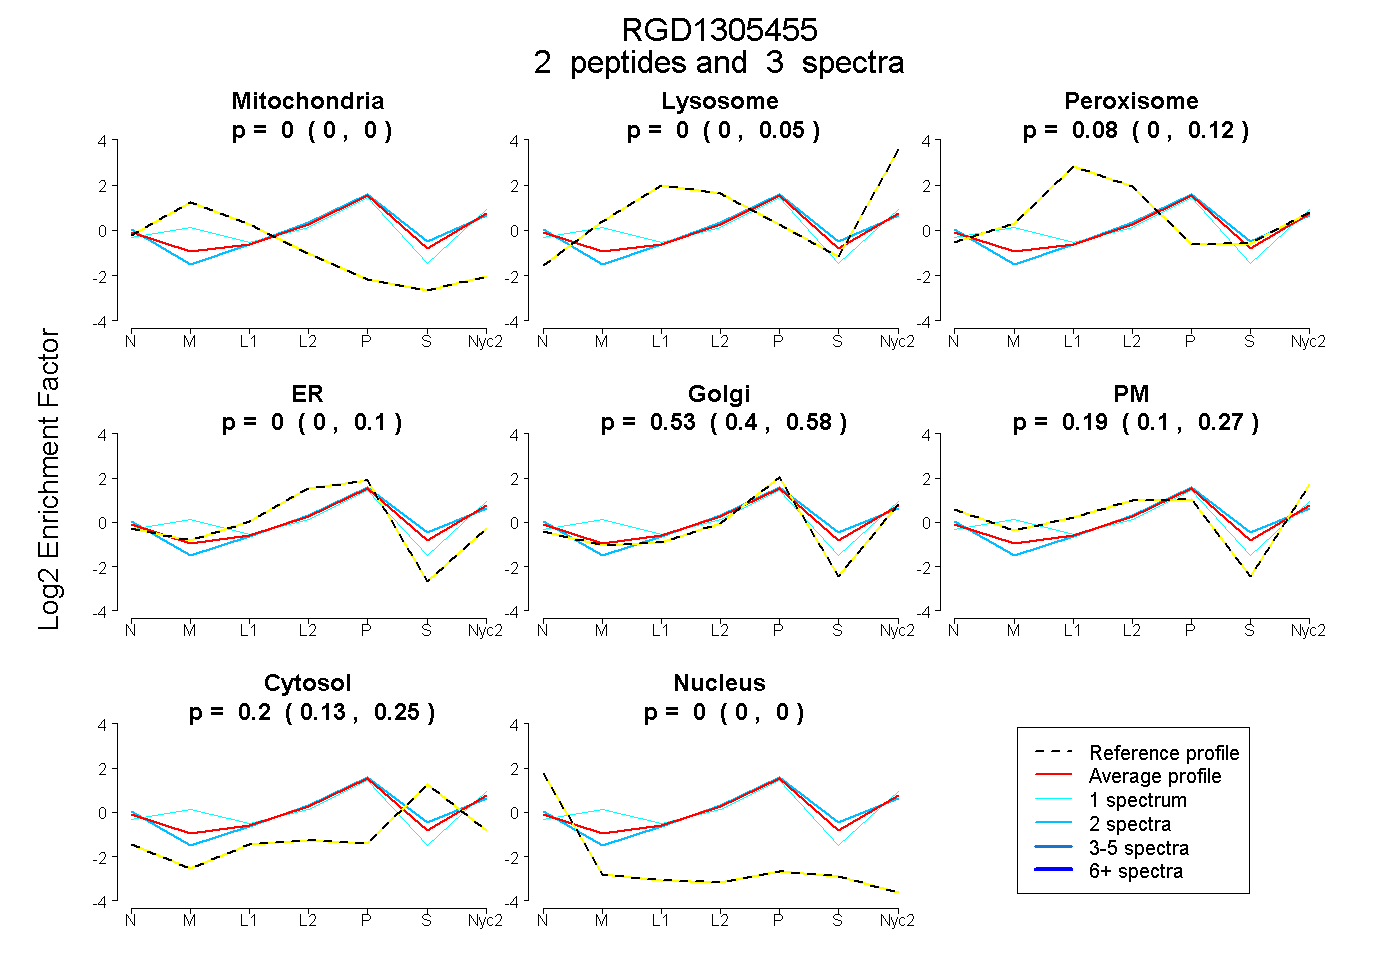
| Plot | Mito | Lyso | Perox | ER | Golgi | PM | Cytosol | Nucleus | |||||
| Expt A |
2 peptides |
3 spectra |
|
0.000 0.000 | 0.000 |
0.002 0.000 | 0.051 |
0.079 0.000 | 0.124 |
0.000 0.000 | 0.098 |
0.530 0.399 | 0.583 |
0.193 0.102 | 0.274 |
0.195 0.135 | 0.254 |
0.000 0.000 | 0.000 |
| 2 spectra, EVEAPEVR | 0.000 | 0.005 | 0.000 | 0.100 | 0.358 | 0.253 | 0.284 | 0.000 | ||
| 1 spectrum, LVWTPEHAQAGK | 0.092 | 0.153 | 0.017 | 0.000 | 0.629 | 0.069 | 0.040 | 0.000 |
| Plot | Mito | Lyso or Perox | ER | Golgi | PM | Cytosol | Nucleus | ||||||
| Expt B |
1 peptide |
1 spectrum |
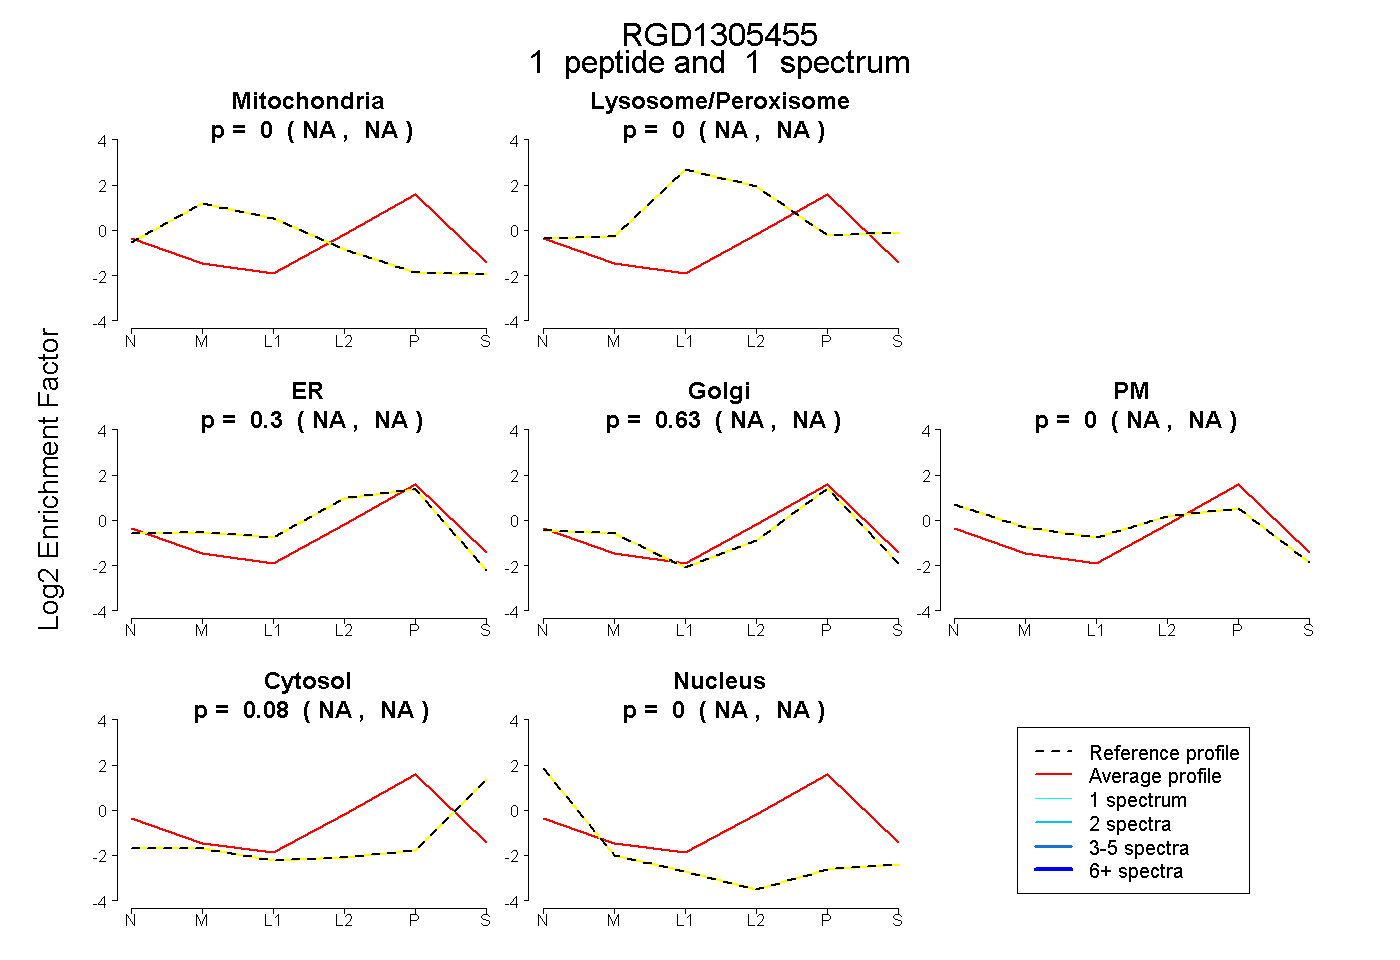 |
0.000 NA | NA |
0.000 NA | NA |
0.297 NA | NA |
0.627 NA | NA |
0.000 NA | NA |
0.077 NA | NA |
0.000 NA | NA |
|||
| Plot | Lyso | Other | |||||||||||
| Expt C |
1 peptide |
1 spectrum |
 |
0.000 NA | NA |
1.000 NA | NA |