 13
13peptides
spectra
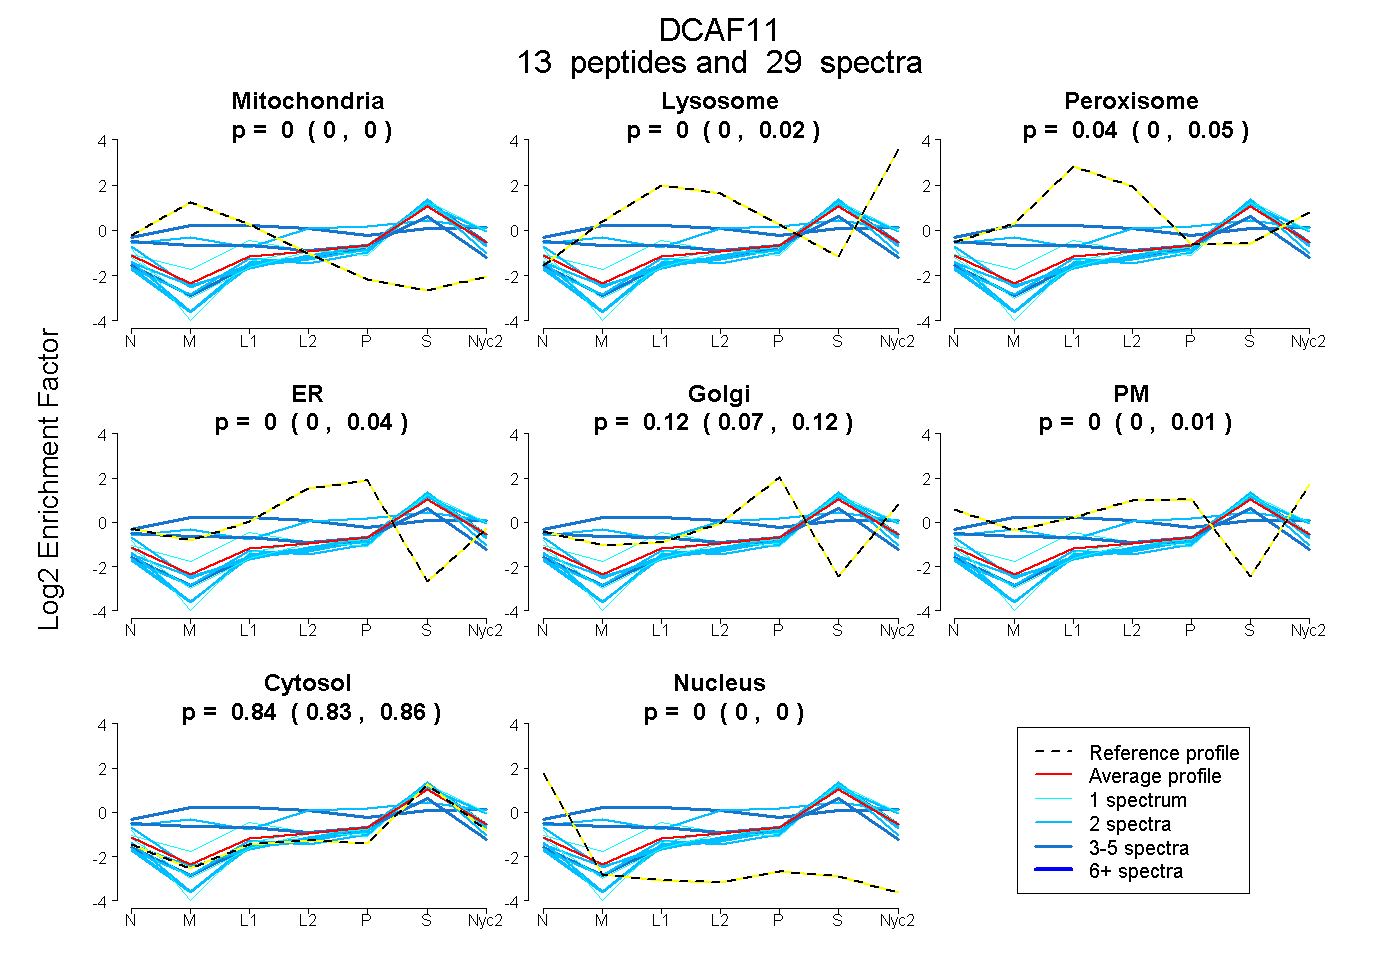
0.000 | 0.000
0.000 | 0.015
0.004 | 0.048
0.000 | 0.035
0.072 | 0.123
0.000 | 0.010
0.832 | 0.857
0.000 | 0.000
4peptides
spectra
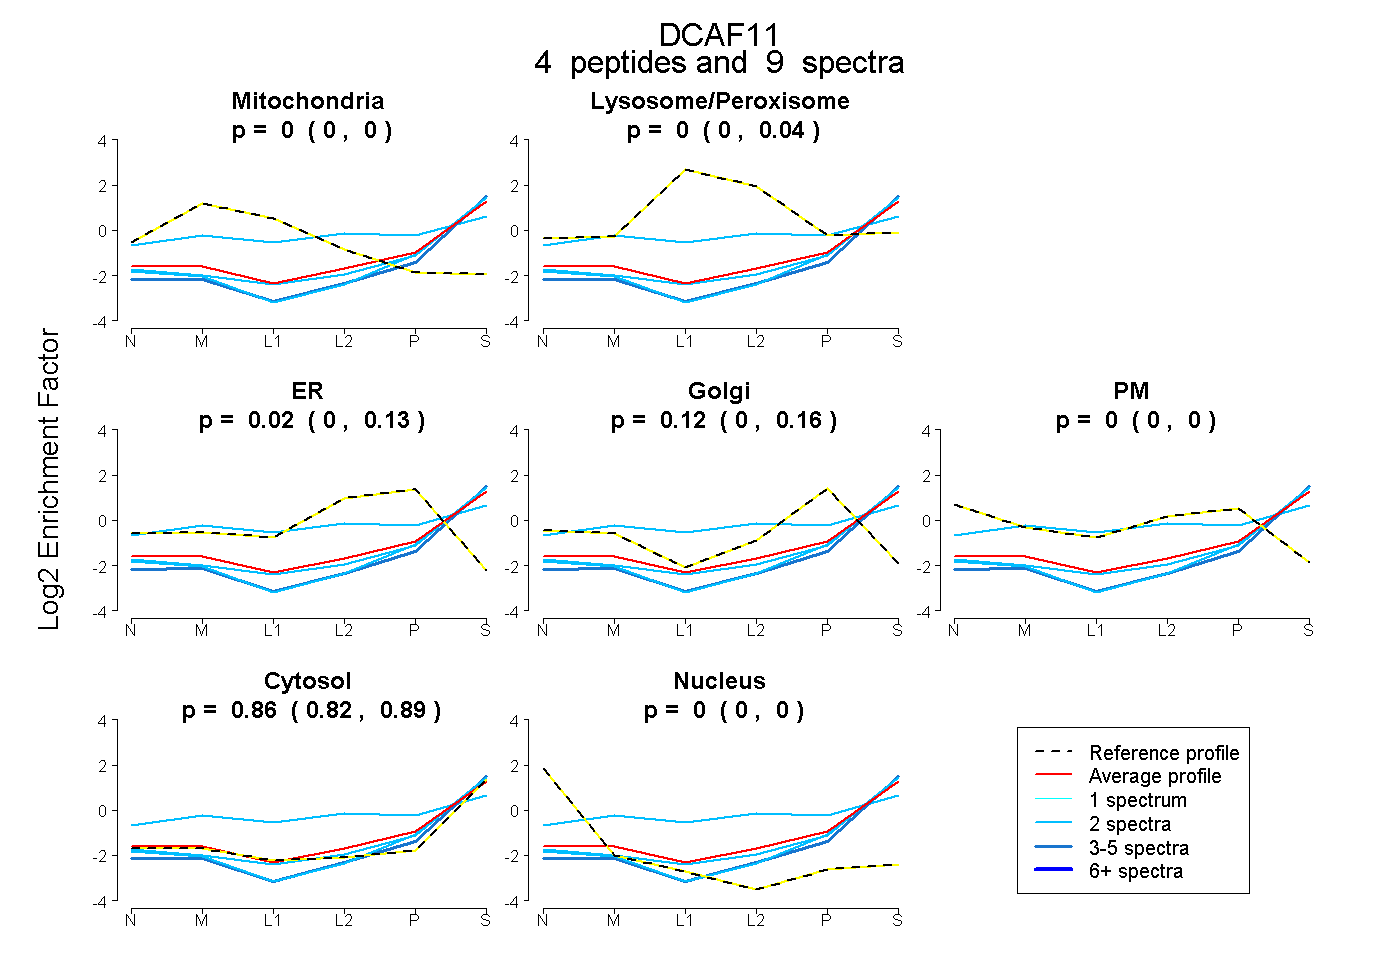
0.000 | 0.000
0.000 | 0.036
0.000 | 0.130
0.000 | 0.160
0.000 | 0.000
0.822 | 0.889
0.000 | 0.000
8peptides
spectra
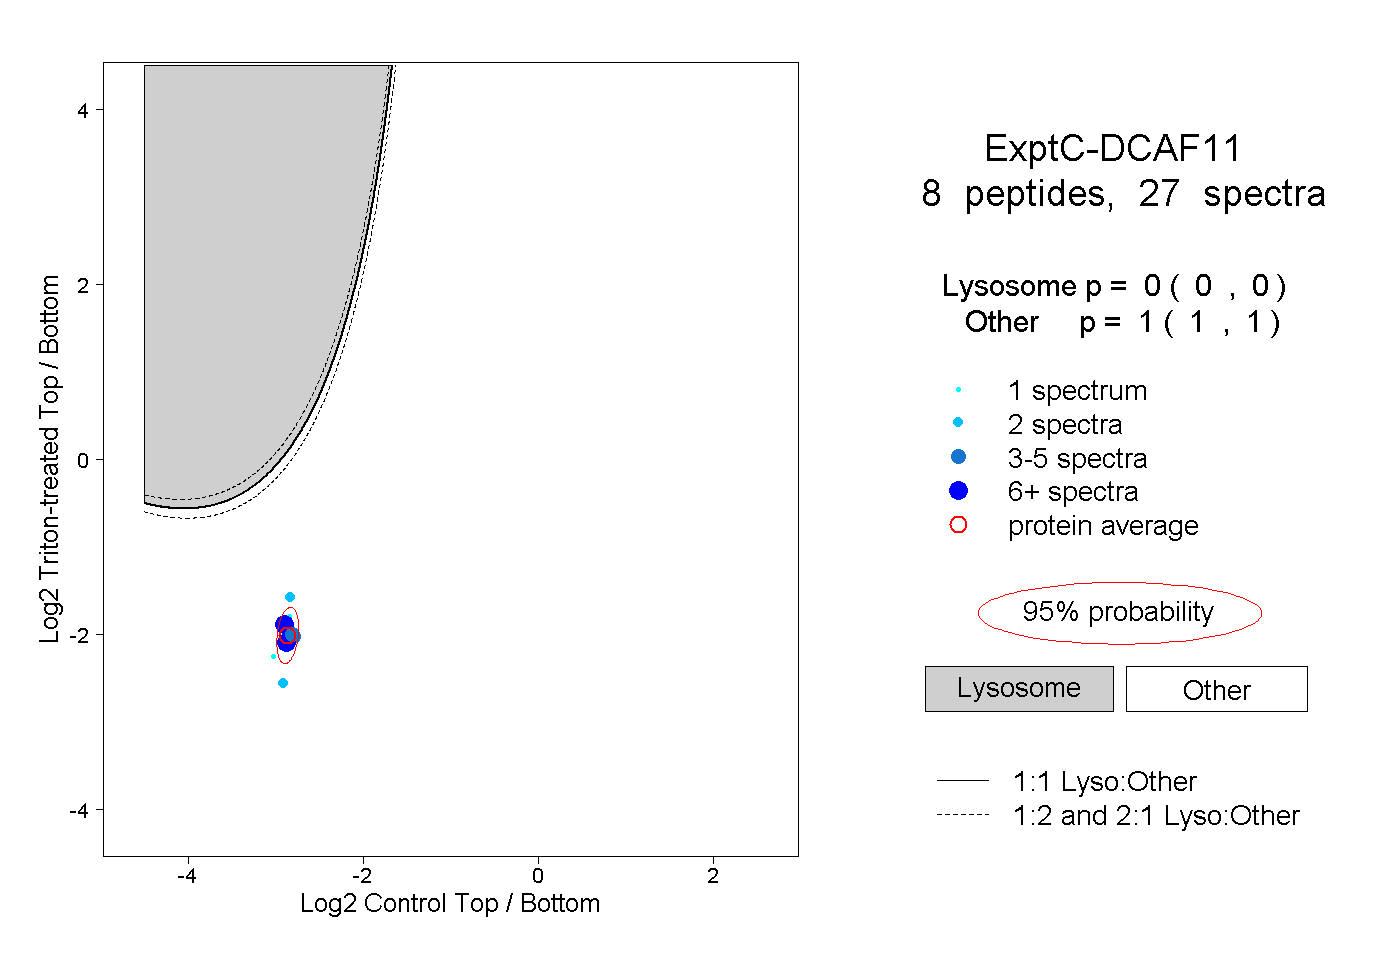
0.000 | 0.000
1.000 | 1.000
1peptide
spectrum
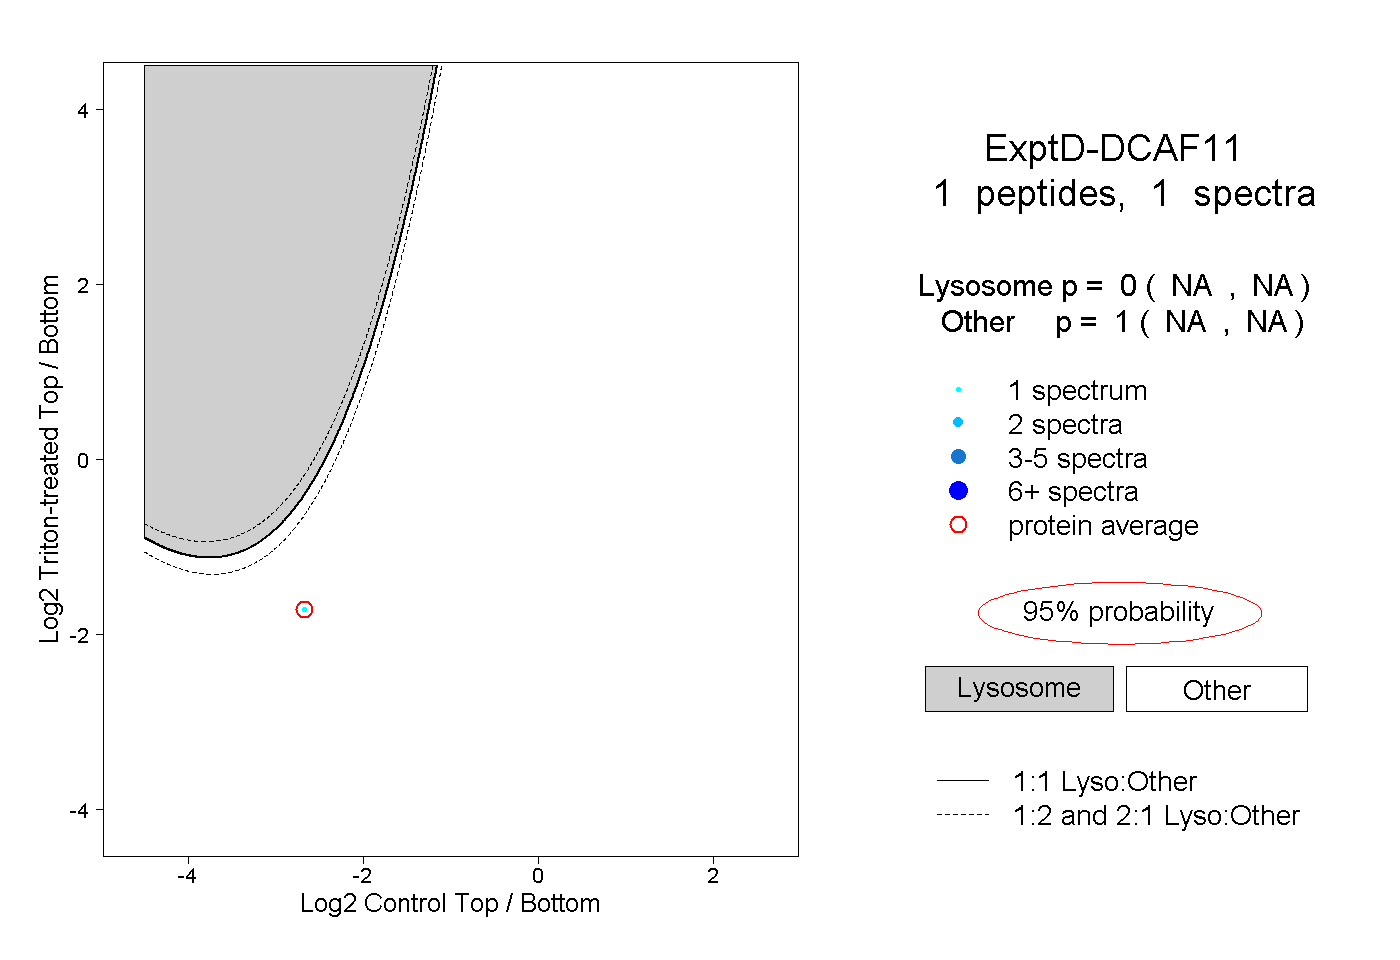
NA | NA
NA | NA