 3
3peptides
spectra
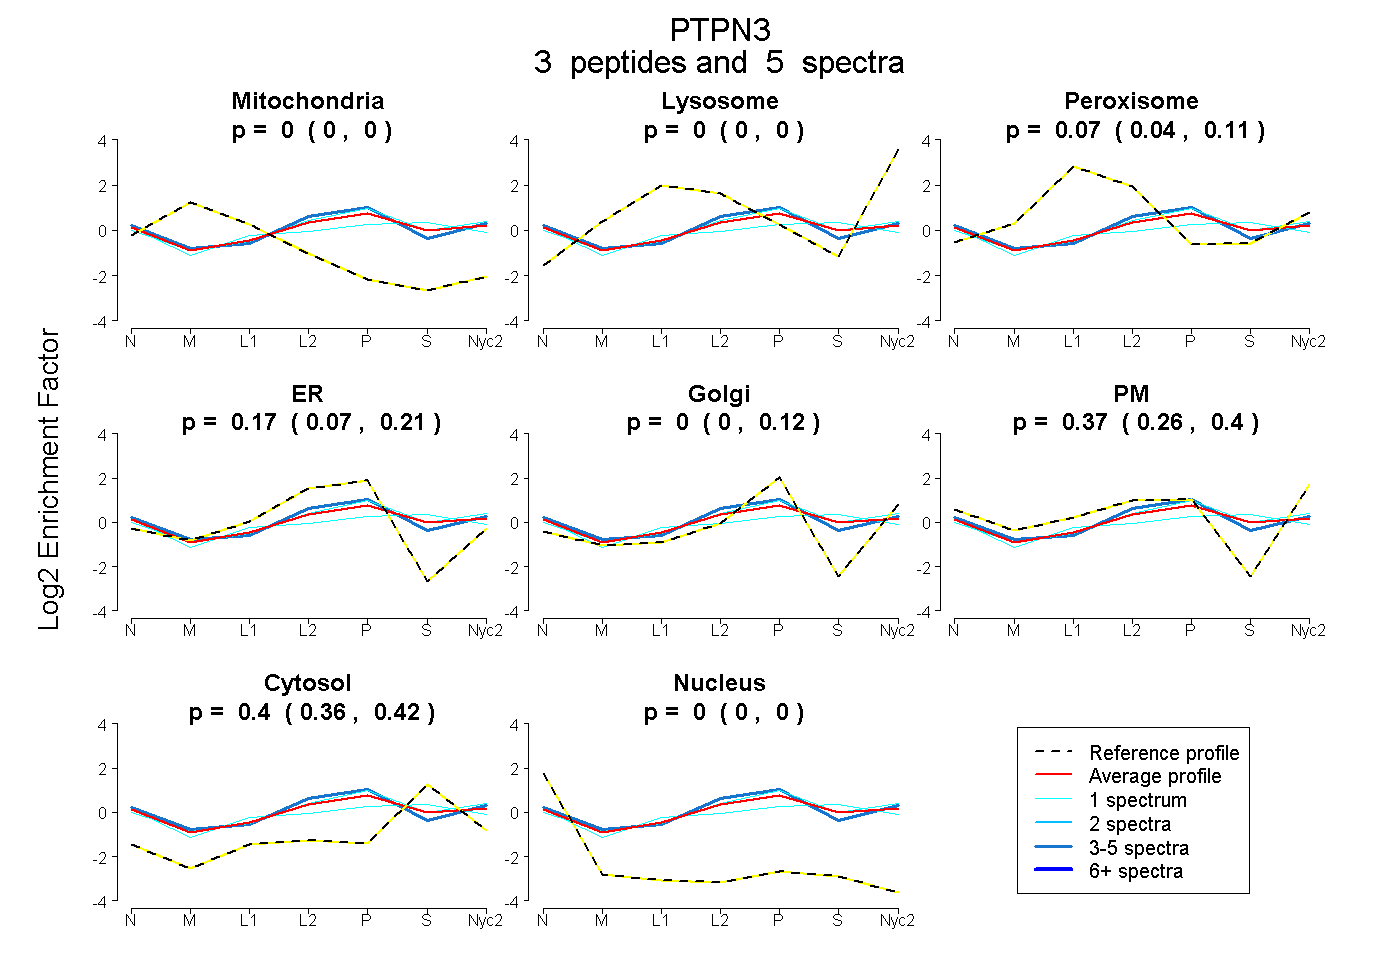
0.000 | 0.000
0.000 | 0.000
0.044 | 0.105
0.073 | 0.214
0.000 | 0.122
0.263 | 0.403
0.358 | 0.416
0.000 | 0.000
7peptides
spectra
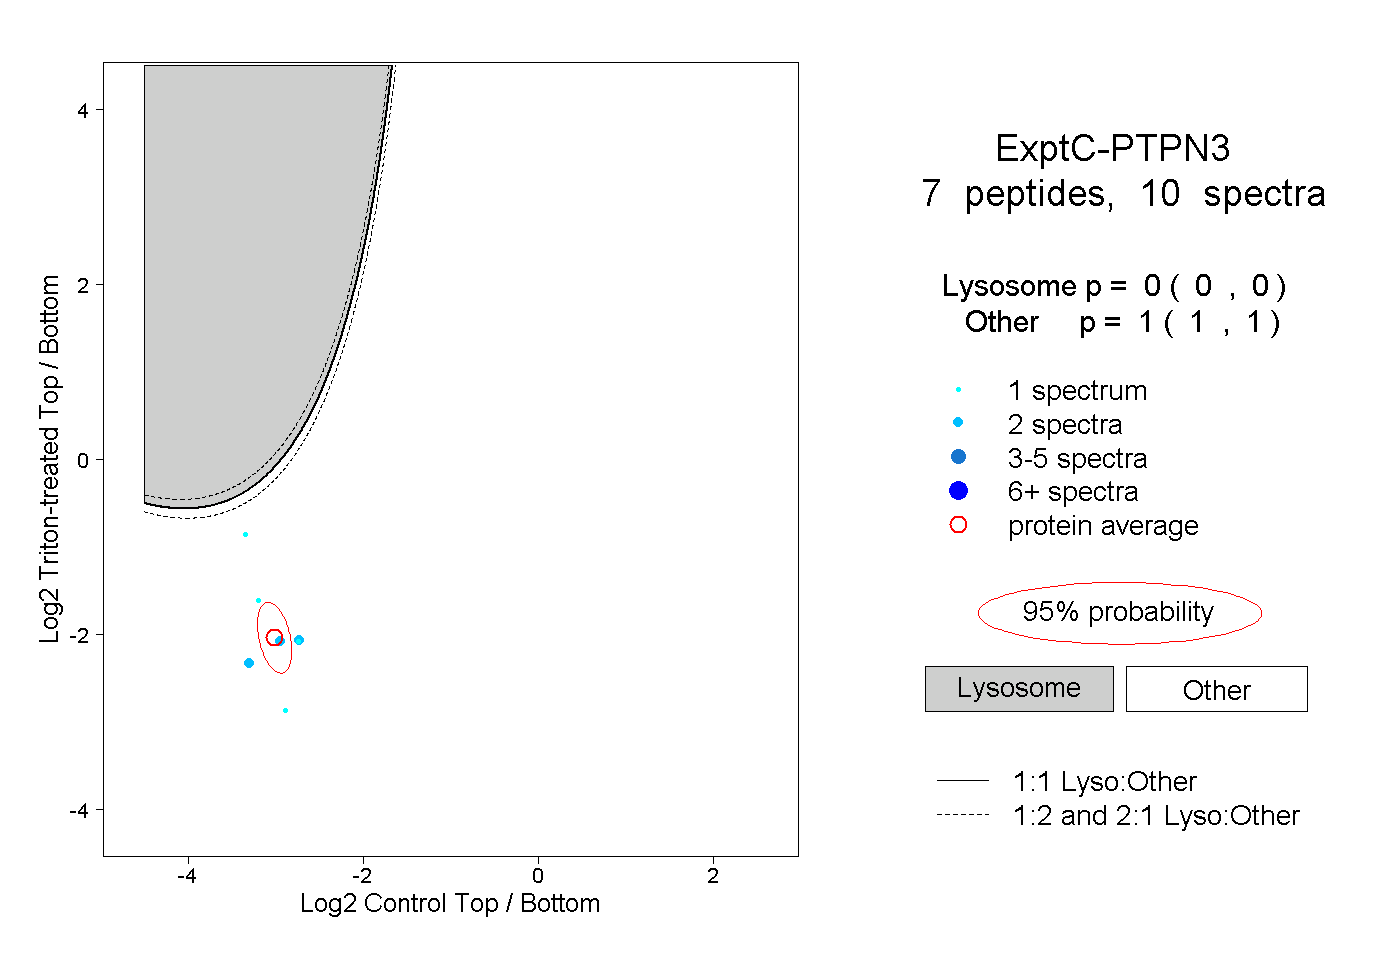
0.000 | 0.000
1.000 | 1.000
1peptide
spectrum
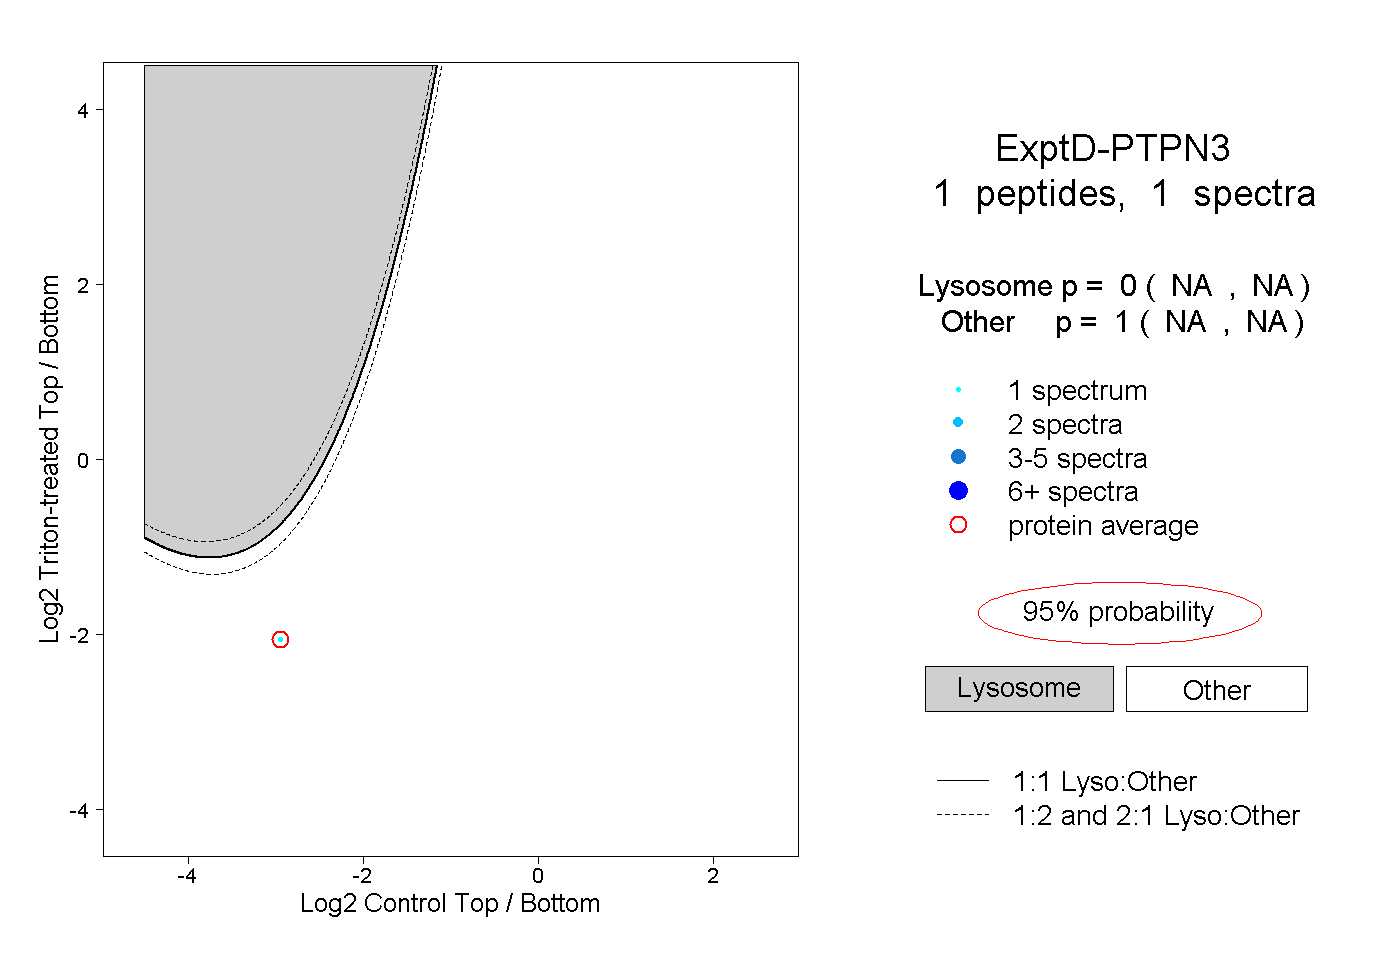
NA | NA
NA | NA