 3
3peptides
spectra
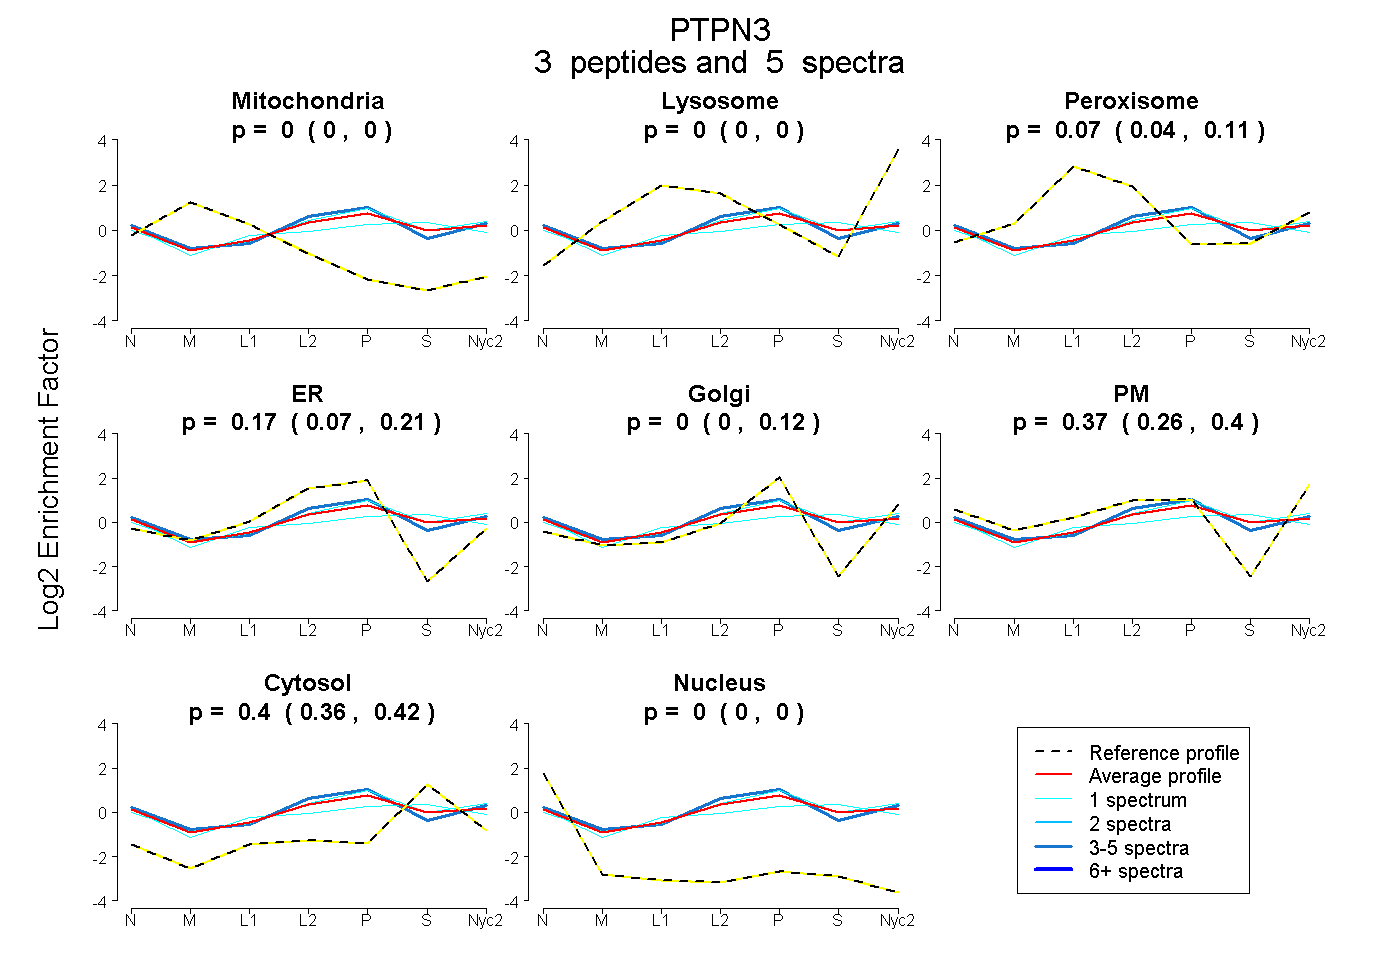
0.000 | 0.000
0.000 | 0.000
0.044 | 0.105
0.073 | 0.214
0.000 | 0.122
0.263 | 0.403
0.358 | 0.416
0.000 | 0.000
| Plot | Mito | Lyso | Perox | ER | Golgi | PM | Cytosol | Nucleus | |||||
| Expt A |
3 peptides |
5 spectra |
|
0.000 0.000 | 0.000 |
0.000 0.000 | 0.000 |
0.067 0.044 | 0.105 |
0.170 0.073 | 0.214 |
0.000 0.000 | 0.122 |
0.366 0.263 | 0.403 |
0.398 0.358 | 0.416 |
0.000 0.000 | 0.000 |
| 1 spectrum, NLPVYPLDIVR | 0.000 | 0.000 | 0.113 | 0.090 | 0.186 | 0.268 | 0.343 | 0.000 | ||
| 3 spectra, FFIHQR | 0.000 | 0.000 | 0.019 | 0.246 | 0.000 | 0.406 | 0.329 | 0.000 | ||
| 1 spectrum, TSELPK | 0.000 | 0.000 | 0.133 | 0.087 | 0.000 | 0.284 | 0.496 | 0.000 |
| Plot | Lyso | Other | |||||||||||
| Expt C |
7 peptides |
10 spectra |
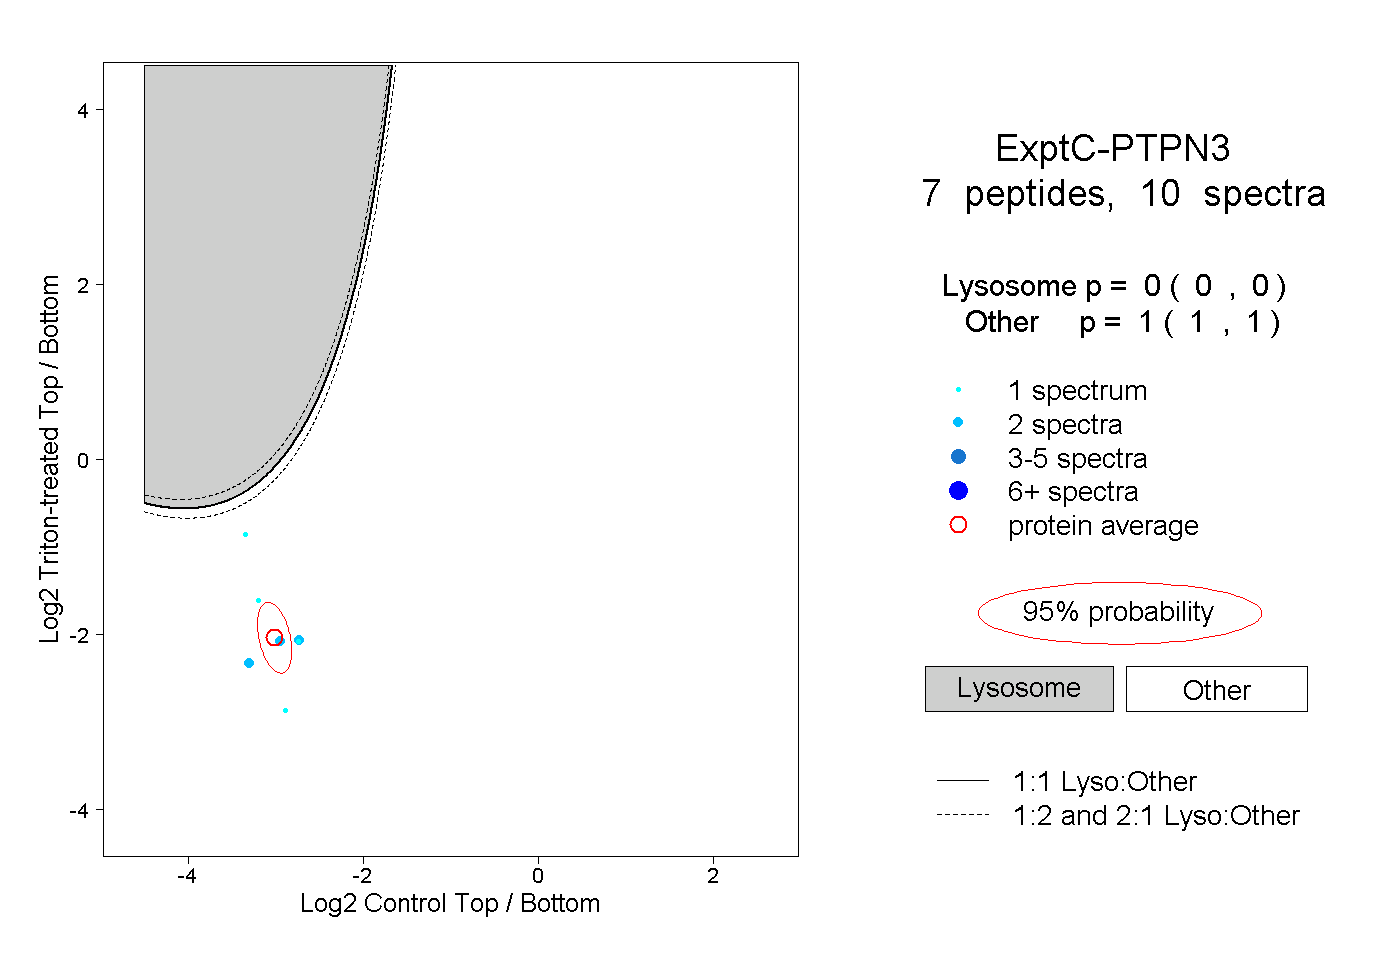 |
0.000 0.000 | 0.000 |
1.000 1.000 | 1.000 |
||||||||
| Plot | Lyso | Other | |||||||||||
| Expt D |
1 peptide |
1 spectrum |
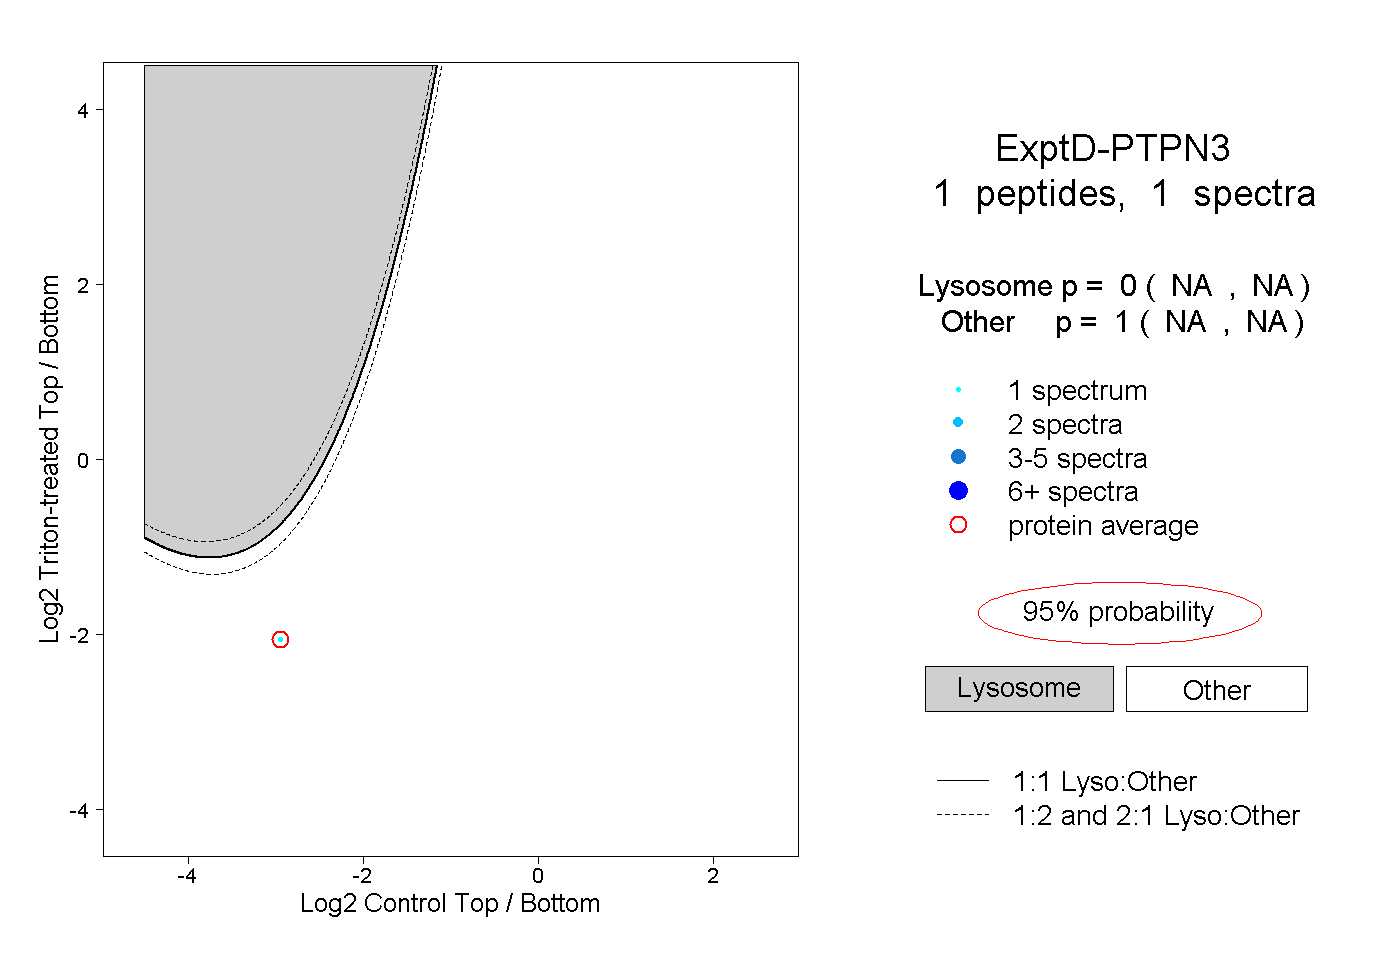 |
0.000 NA | NA |
1.000 NA | NA |