 5
5peptides
spectra
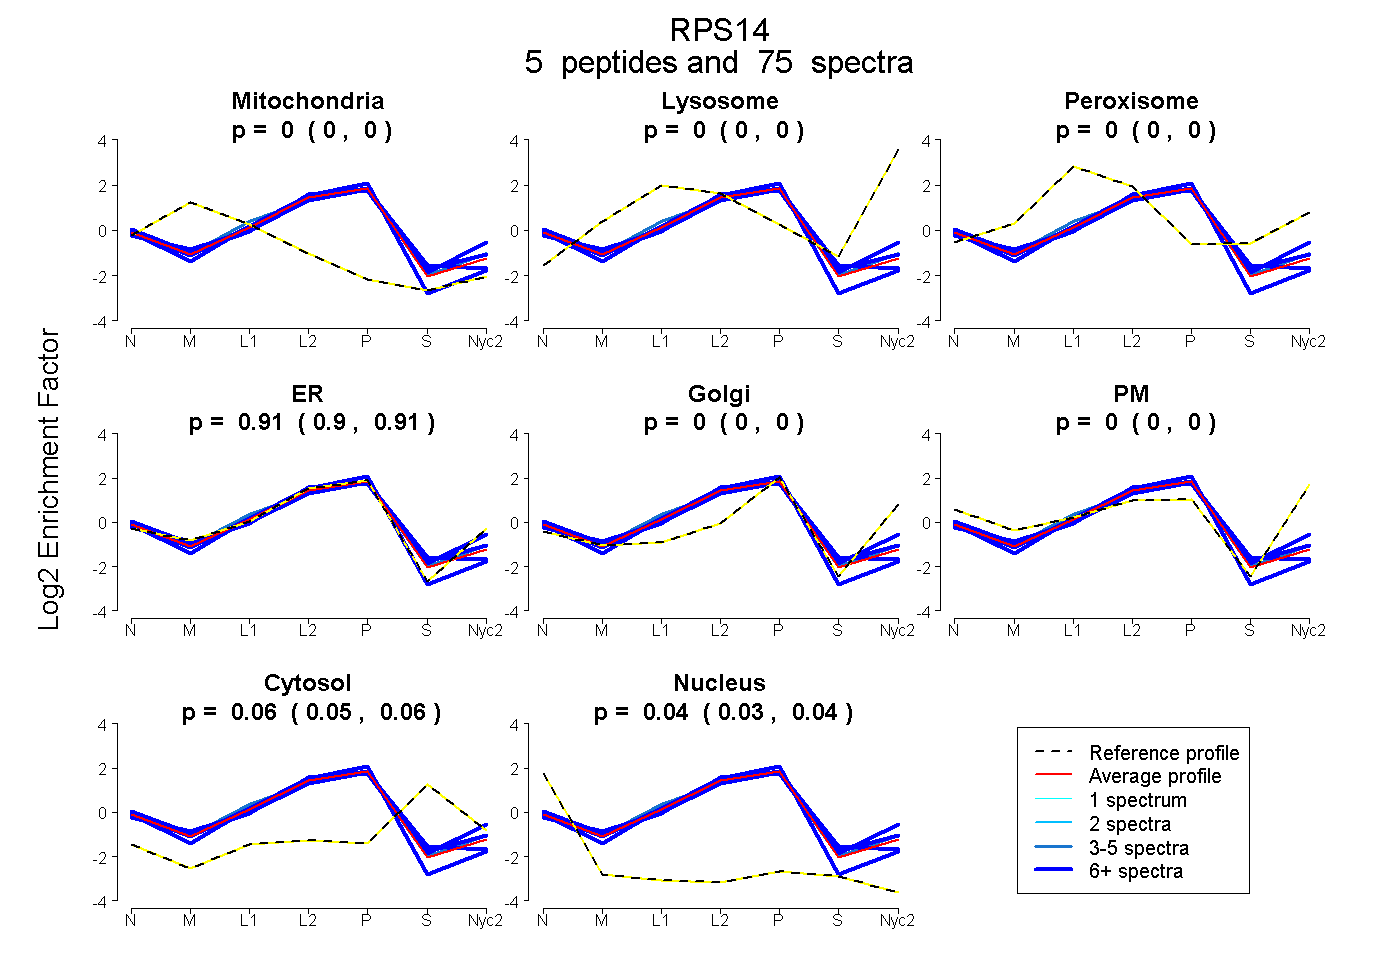
0.000 | 0.000
0.000 | 0.000
0.000 | 0.000
0.903 | 0.912
0.000 | 0.000
0.000 | 0.000
0.047 | 0.064
0.030 | 0.040
3peptides
spectra
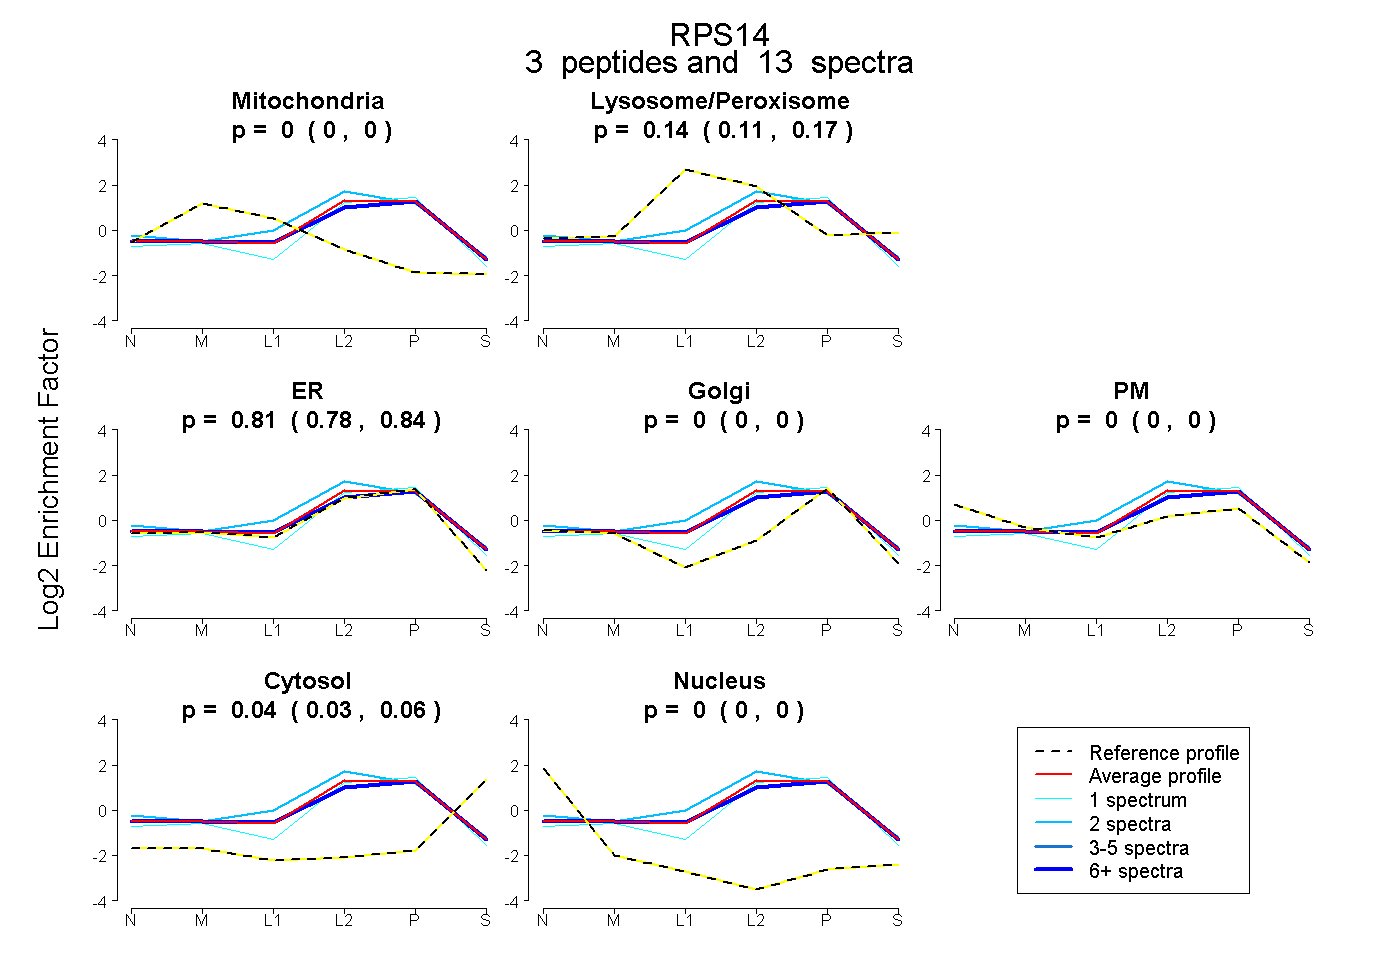
0.000 | 0.000
0.110 | 0.173
0.783 | 0.838
0.000 | 0.000
0.000 | 0.000
0.026 | 0.055
0.000 | 0.000
5peptides
spectra
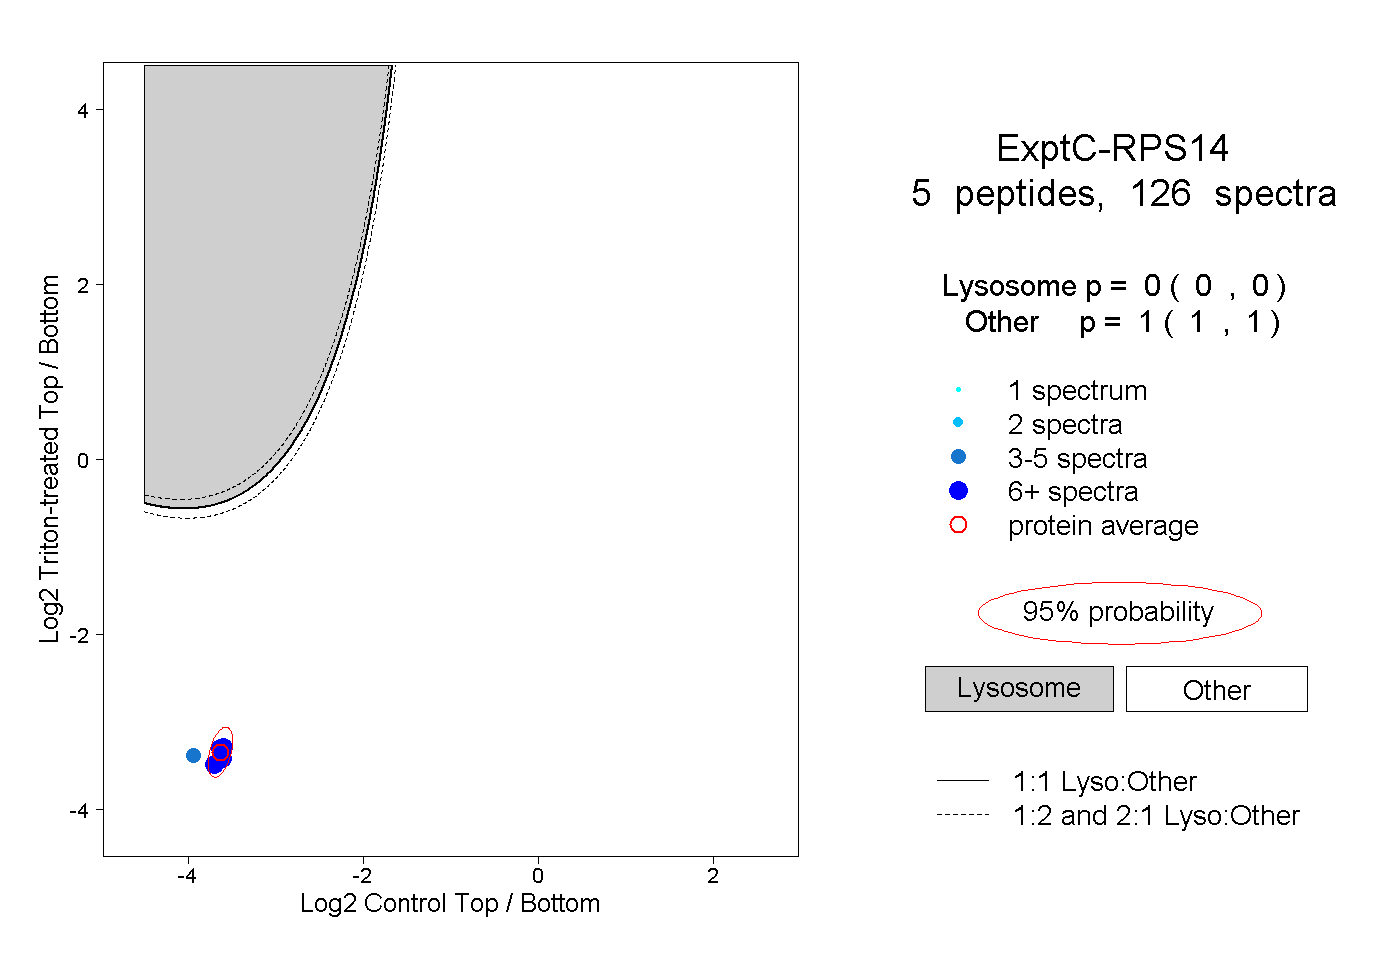
0.000 | 0.000
1.000 | 1.000
2peptides
spectra
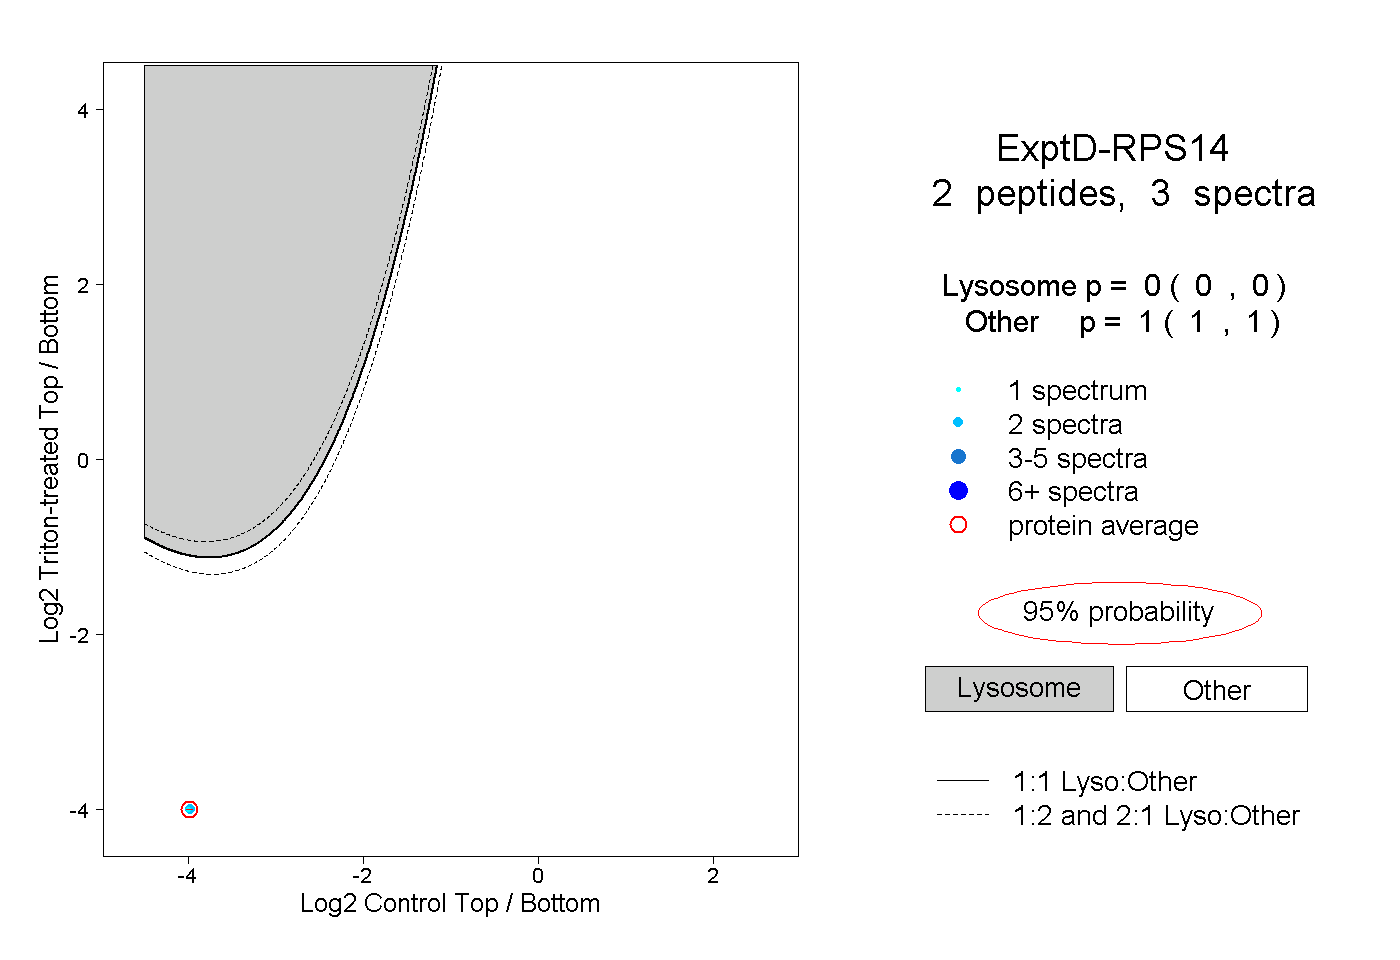
0.000 | 0.000
1.000 | 1.000