 5
5peptides
spectra
0.000 | 0.000
0.000 | 0.000
0.000 | 0.000
0.903 | 0.912
0.000 | 0.000
0.000 | 0.000
0.047 | 0.064
0.030 | 0.040
| Plot | Mito | Lyso | Perox | ER | Golgi | PM | Cytosol | Nucleus | |||||
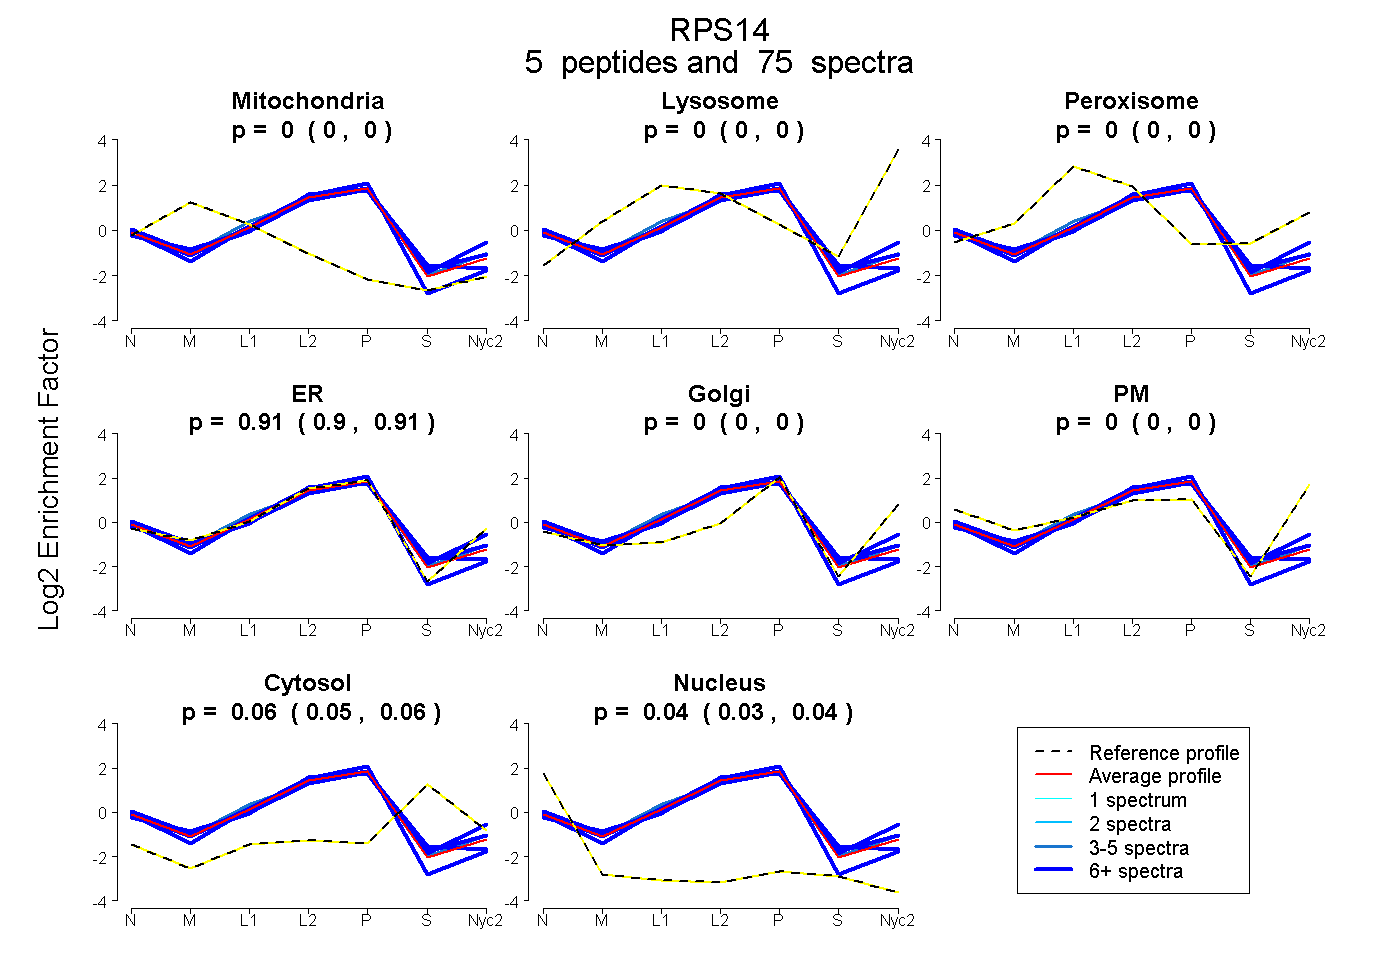
| Expt A |
5 peptides |
75 spectra |
|
0.000 0.000 | 0.000 |
0.000 0.000 | 0.000 |
0.000 0.000 | 0.000 |
0.908 0.903 | 0.912 |
0.000 0.000 | 0.000 |
0.000 0.000 | 0.000 |
0.056 0.047 | 0.064 |
0.036 0.030 | 0.040 |
| 5 spectra, DESSPYAAMLAAQDVAQR | 0.000 | 0.000 | 0.057 | 0.861 | 0.000 | 0.000 | 0.038 | 0.043 | ||
| 12 spectra, VTGGMK | 0.000 | 0.000 | 0.019 | 0.891 | 0.000 | 0.000 | 0.089 | 0.000 | ||
| 37 spectra, TPGPGAQSALR | 0.000 | 0.000 | 0.000 | 0.924 | 0.000 | 0.000 | 0.000 | 0.076 | ||
| 12 spectra, IEDVTPIPSDSTR | 0.000 | 0.000 | 0.005 | 0.888 | 0.000 | 0.000 | 0.107 | 0.000 | ||
| 9 spectra, ELGITALHIK | 0.014 | 0.000 | 0.000 | 0.838 | 0.000 | 0.000 | 0.125 | 0.023 |
| Plot | Mito | Lyso or Perox | ER | Golgi | PM | Cytosol | Nucleus | ||||||
| Expt B |
3 peptides |
13 spectra |
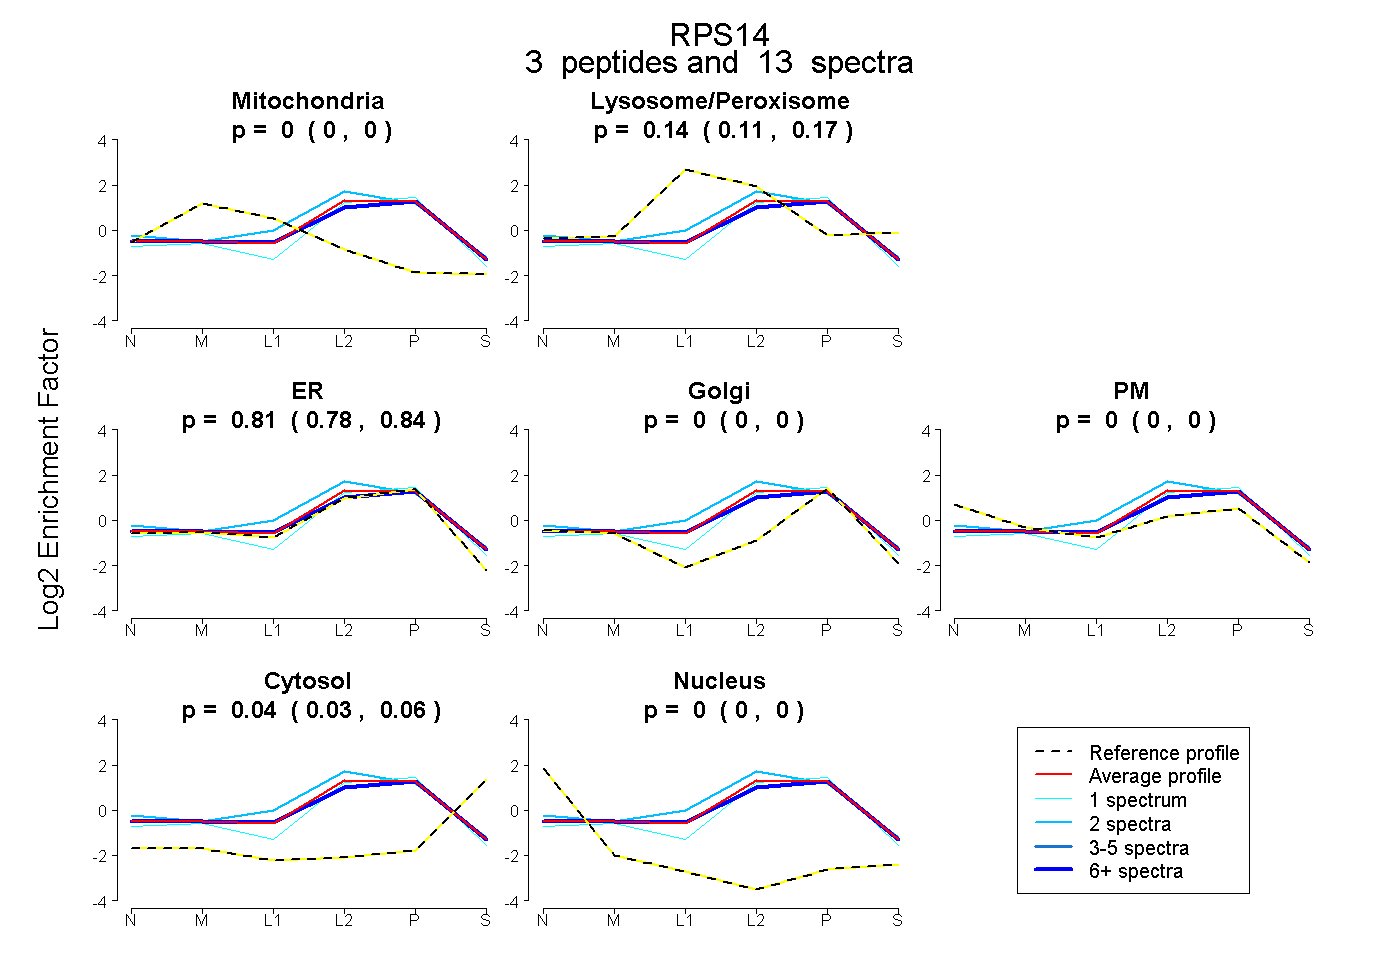 |
0.000 0.000 | 0.000 |
0.145 0.110 | 0.173 |
0.814 0.783 | 0.838 |
0.000 0.000 | 0.000 |
0.000 0.000 | 0.000 |
0.042 0.026 | 0.055 |
0.000 0.000 | 0.000 |
|||
| Plot | Lyso | Other | |||||||||||
| Expt C |
5 peptides |
126 spectra |
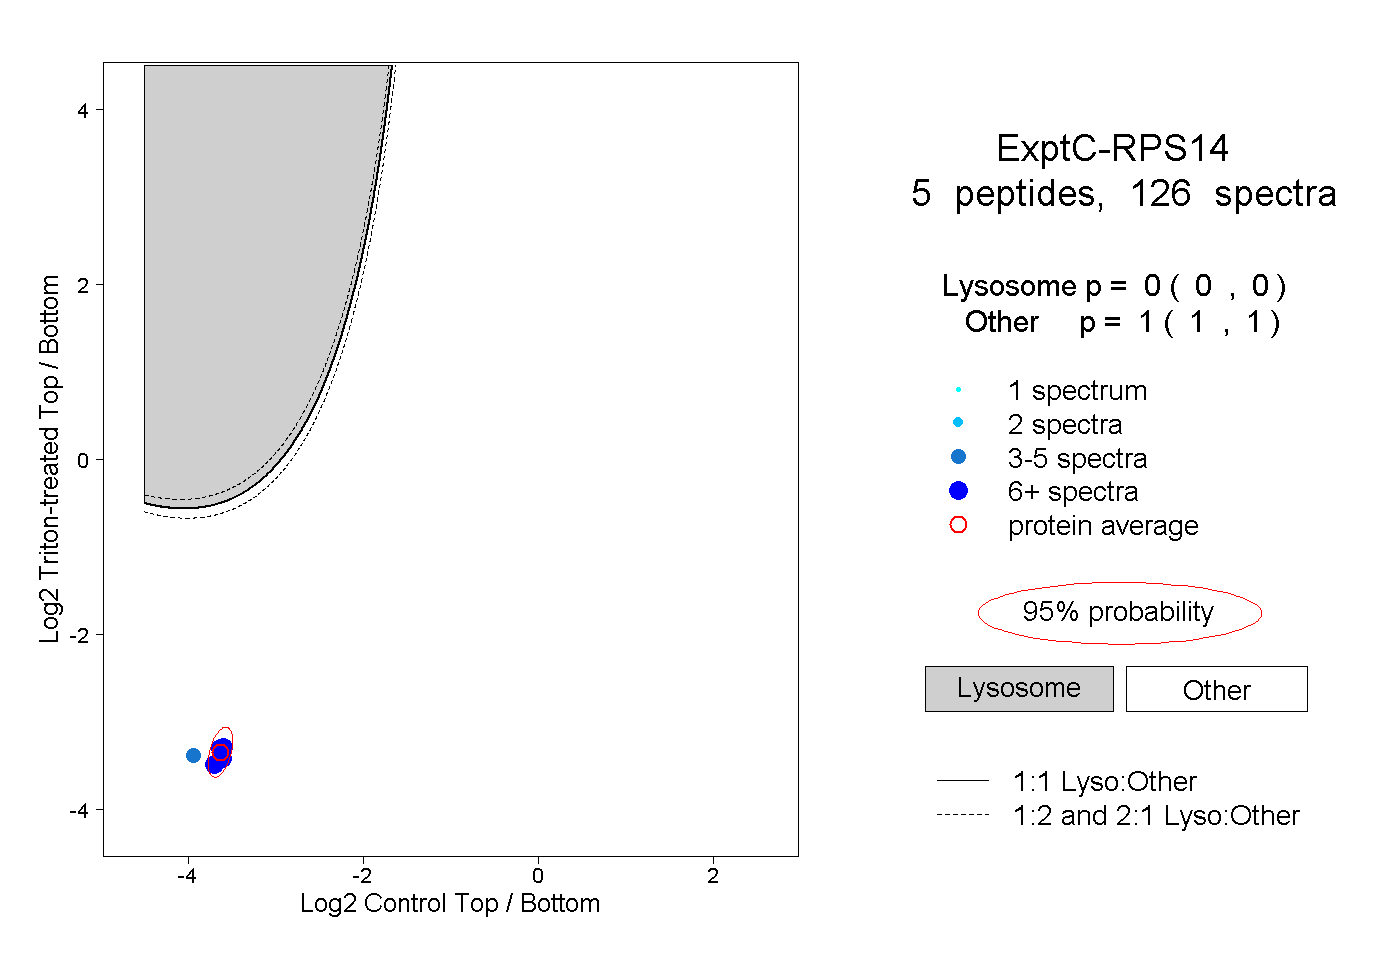 |
0.000 0.000 | 0.000 |
1.000 1.000 | 1.000 |
||||||||
| Plot | Lyso | Other | |||||||||||
| Expt D |
2 peptides |
3 spectra |
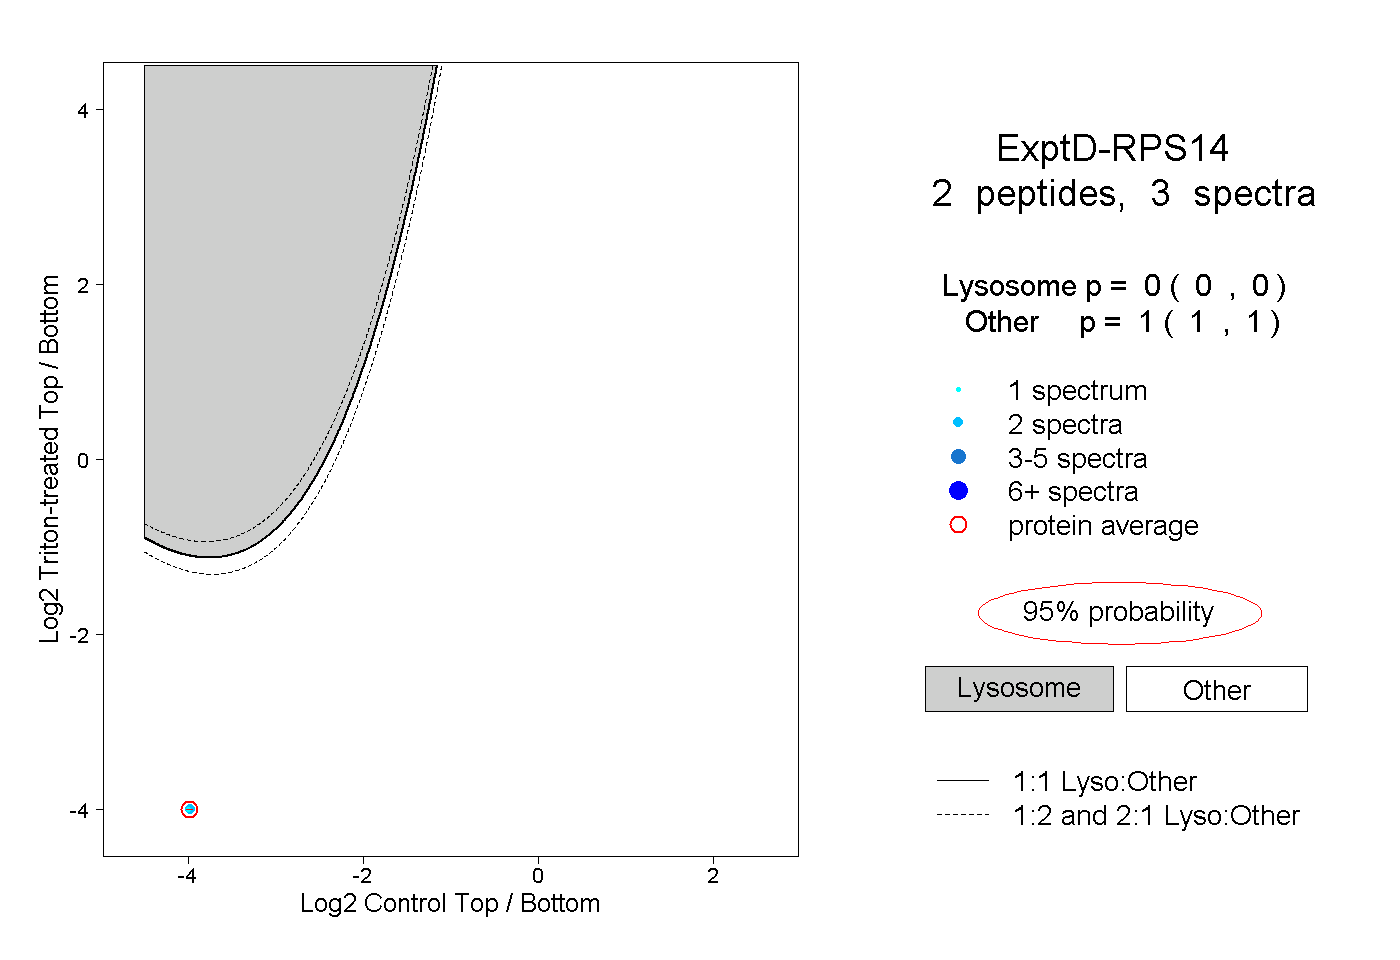 |
0.000 0.000 | 0.000 |
1.000 1.000 | 1.000 |