 4
4peptides
spectra
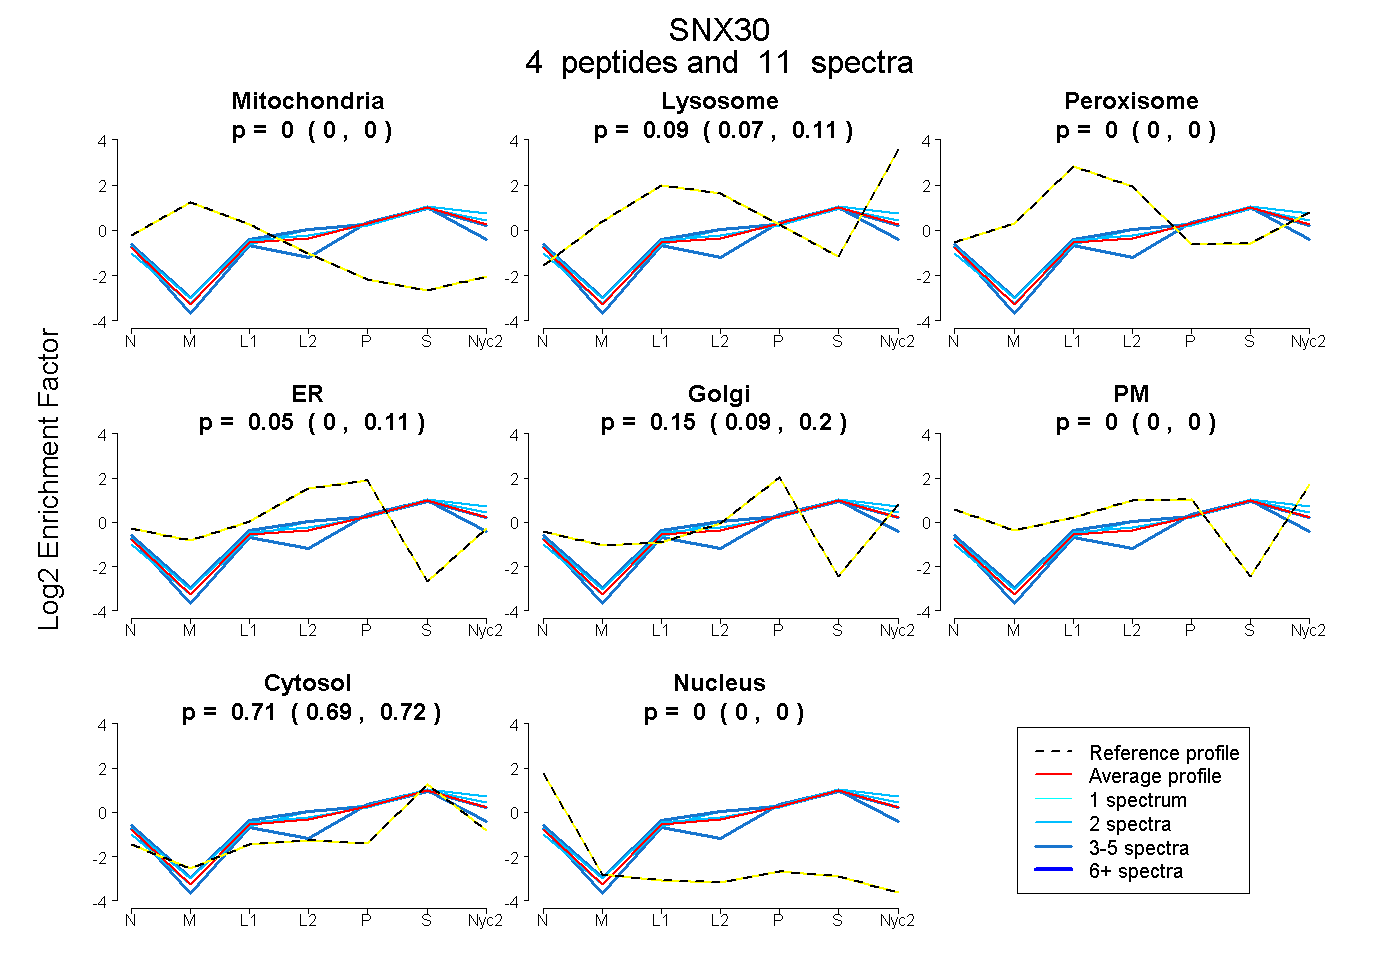
0.000 | 0.000
0.067 | 0.108
0.000 | 0.000
0.000 | 0.112
0.085 | 0.199
0.000 | 0.000
0.692 | 0.716
0.000 | 0.000
7peptides
spectra
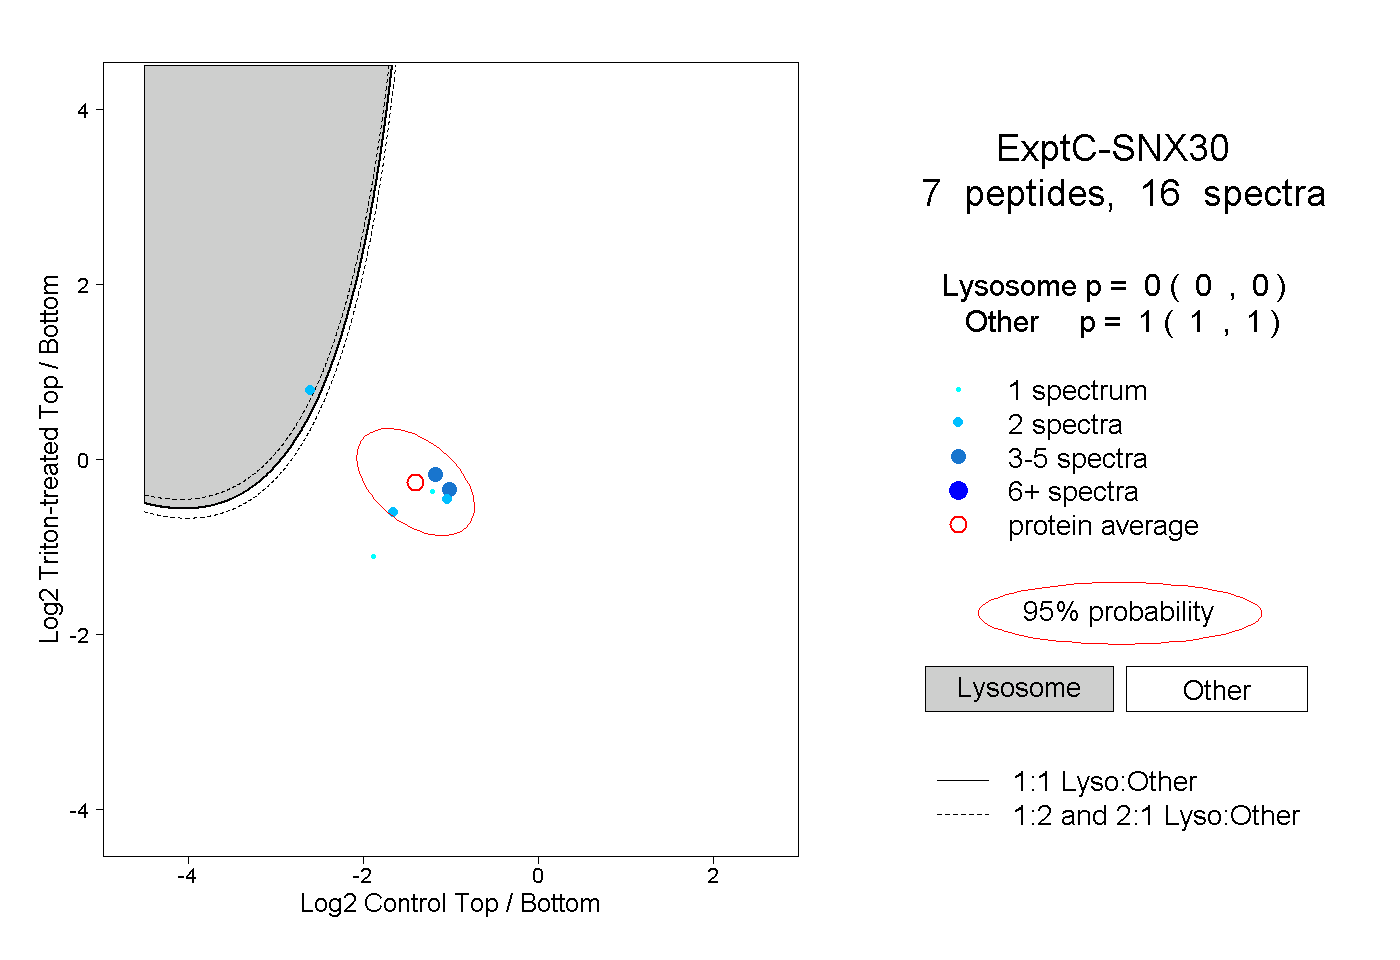
0.000 | 0.000
1.000 | 1.000
1peptide
spectrum
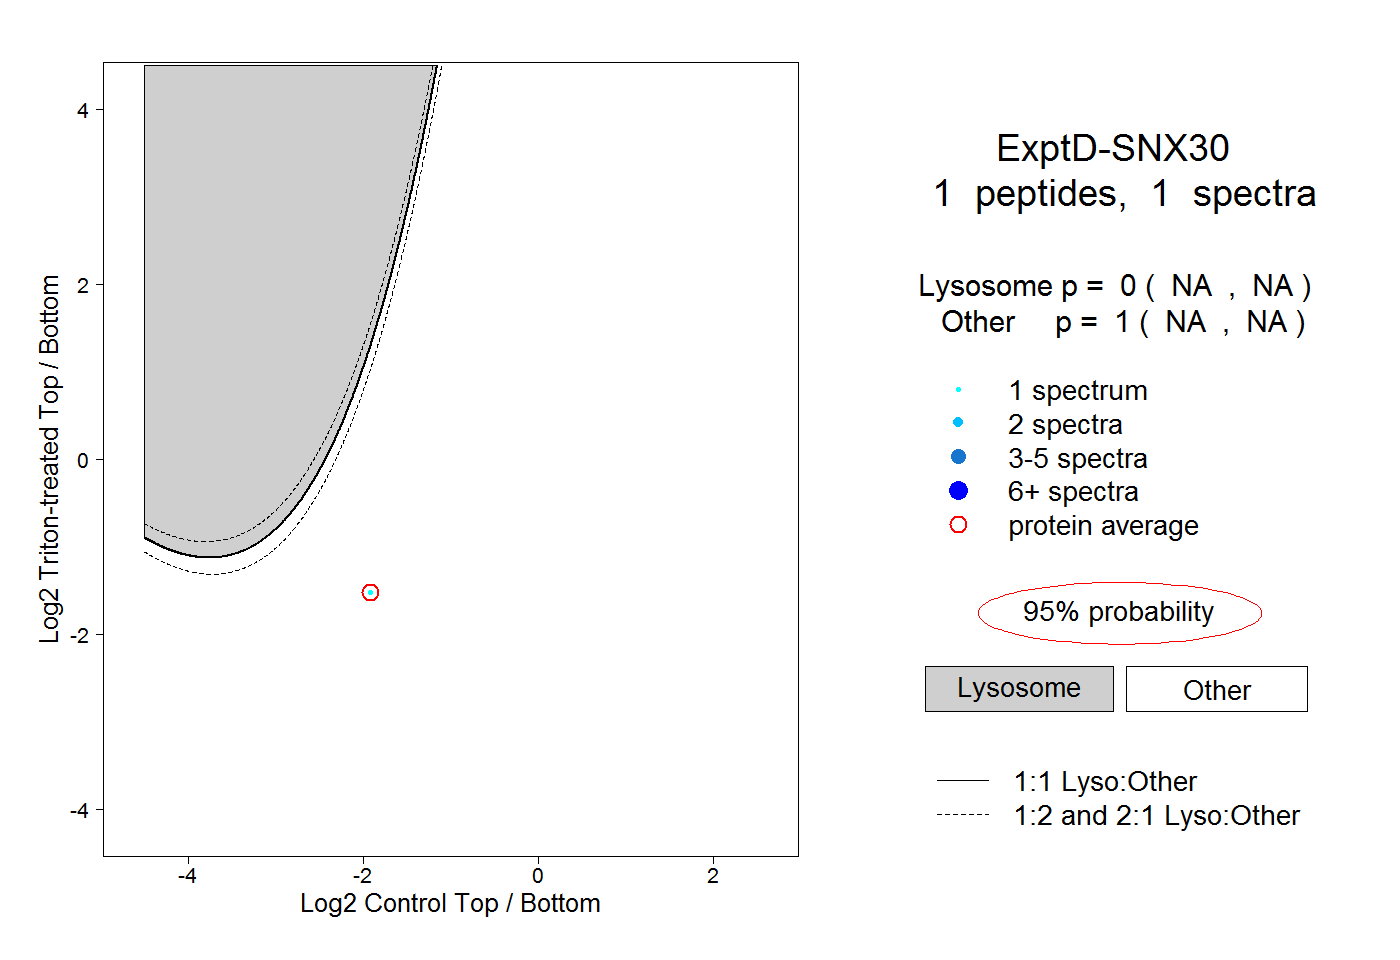
NA | NA
NA | NA