 4
4peptides
spectra
0.000 | 0.000
0.067 | 0.108
0.000 | 0.000
0.000 | 0.112
0.085 | 0.199
0.000 | 0.000
0.692 | 0.716
0.000 | 0.000
| Plot | Mito | Lyso | Perox | ER | Golgi | PM | Cytosol | Nucleus | |||||
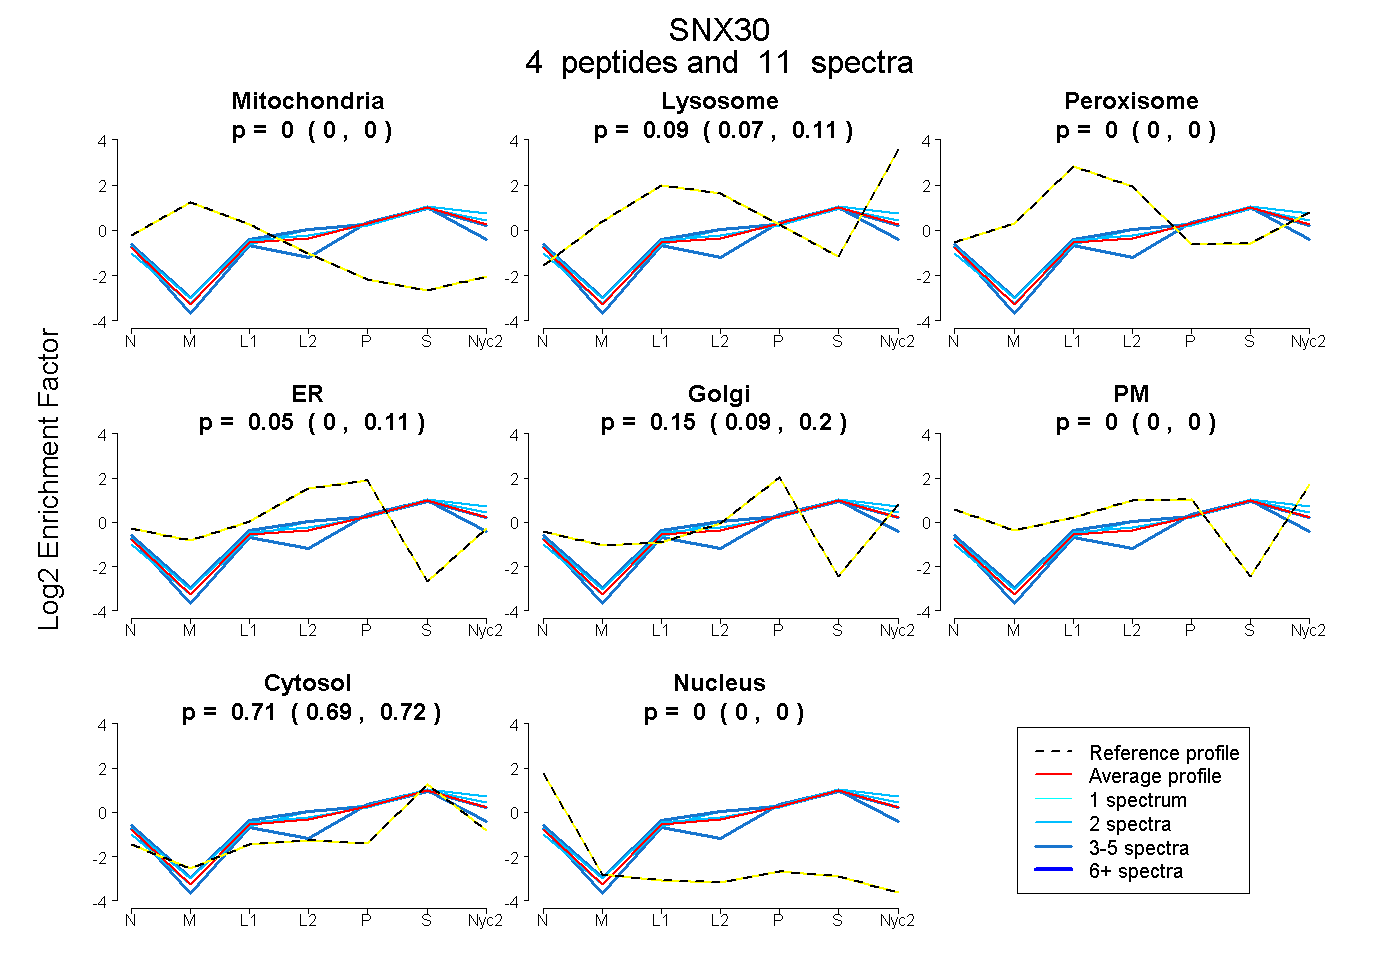
| Expt A |
4 peptides |
11 spectra |
|
0.000 0.000 | 0.000 |
0.089 0.067 | 0.108 |
0.000 0.000 | 0.000 |
0.055 0.000 | 0.112 |
0.151 0.085 | 0.199 |
0.000 0.000 | 0.000 |
0.705 0.692 | 0.716 |
0.000 0.000 | 0.000 |
| 2 spectra, FSEEFVETR | 0.000 | 0.172 | 0.000 | 0.000 | 0.153 | 0.000 | 0.674 | 0.000 | ||
| 2 spectra, VEFDLPEYSVR | 0.000 | 0.130 | 0.000 | 0.030 | 0.114 | 0.043 | 0.683 | 0.000 | ||
| 4 spectra, ALPSTGPQSLR | 0.000 | 0.000 | 0.000 | 0.000 | 0.218 | 0.000 | 0.782 | 0.000 | ||
| 3 spectra, LQLDDDIDGETR | 0.000 | 0.106 | 0.000 | 0.173 | 0.000 | 0.047 | 0.673 | 0.000 |
| Plot | Lyso | Other | |||||||||||
| Expt C |
7 peptides |
16 spectra |
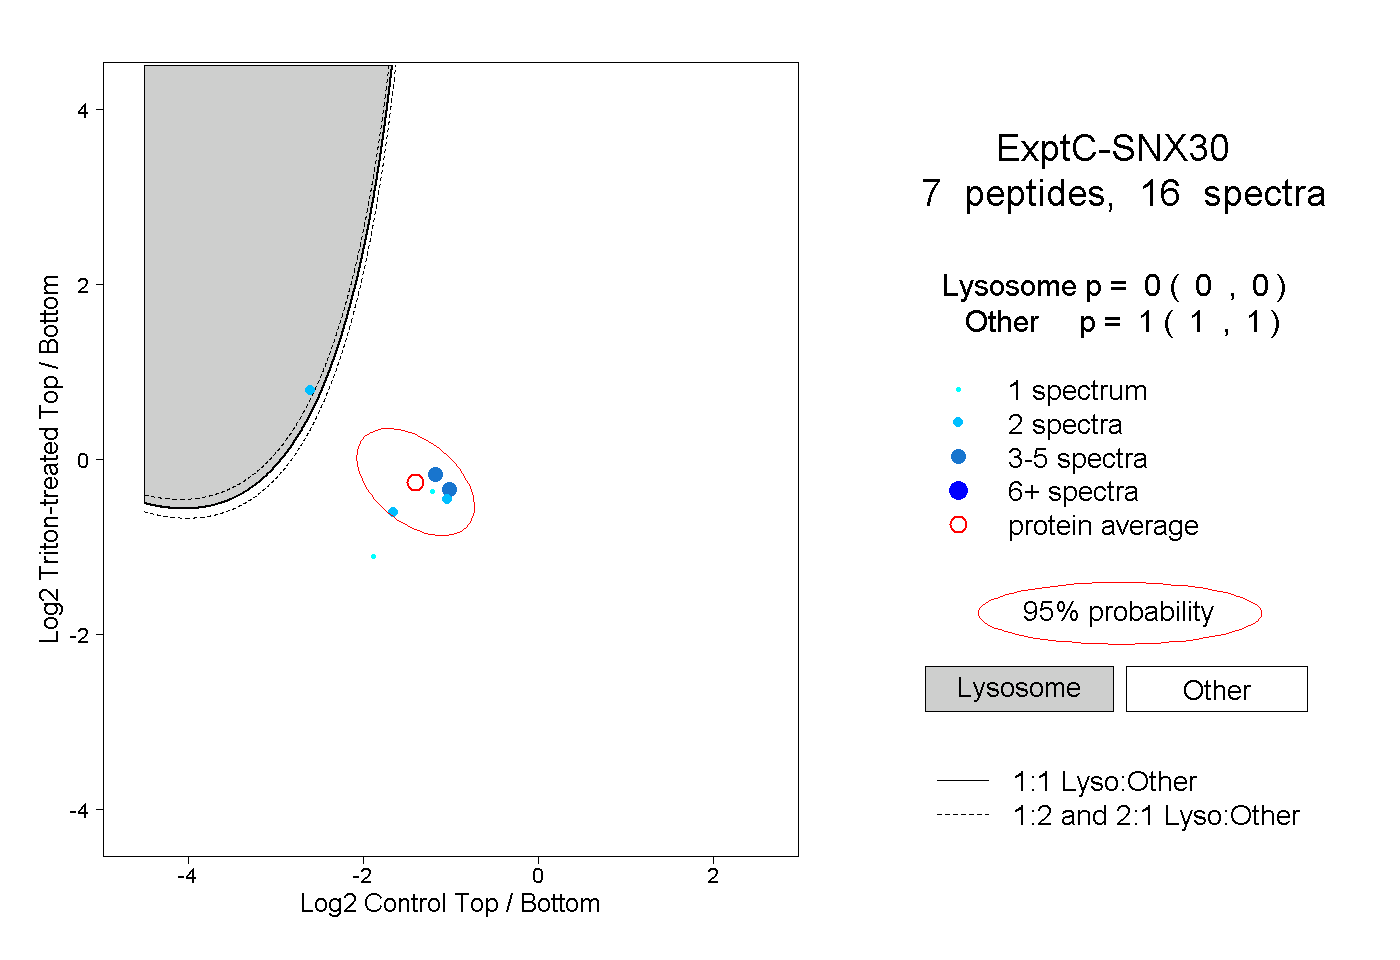 |
0.000 0.000 | 0.000 |
1.000 1.000 | 1.000 |
||||||||
| Plot | Lyso | Other | |||||||||||
| Expt D |
1 peptide |
1 spectrum |
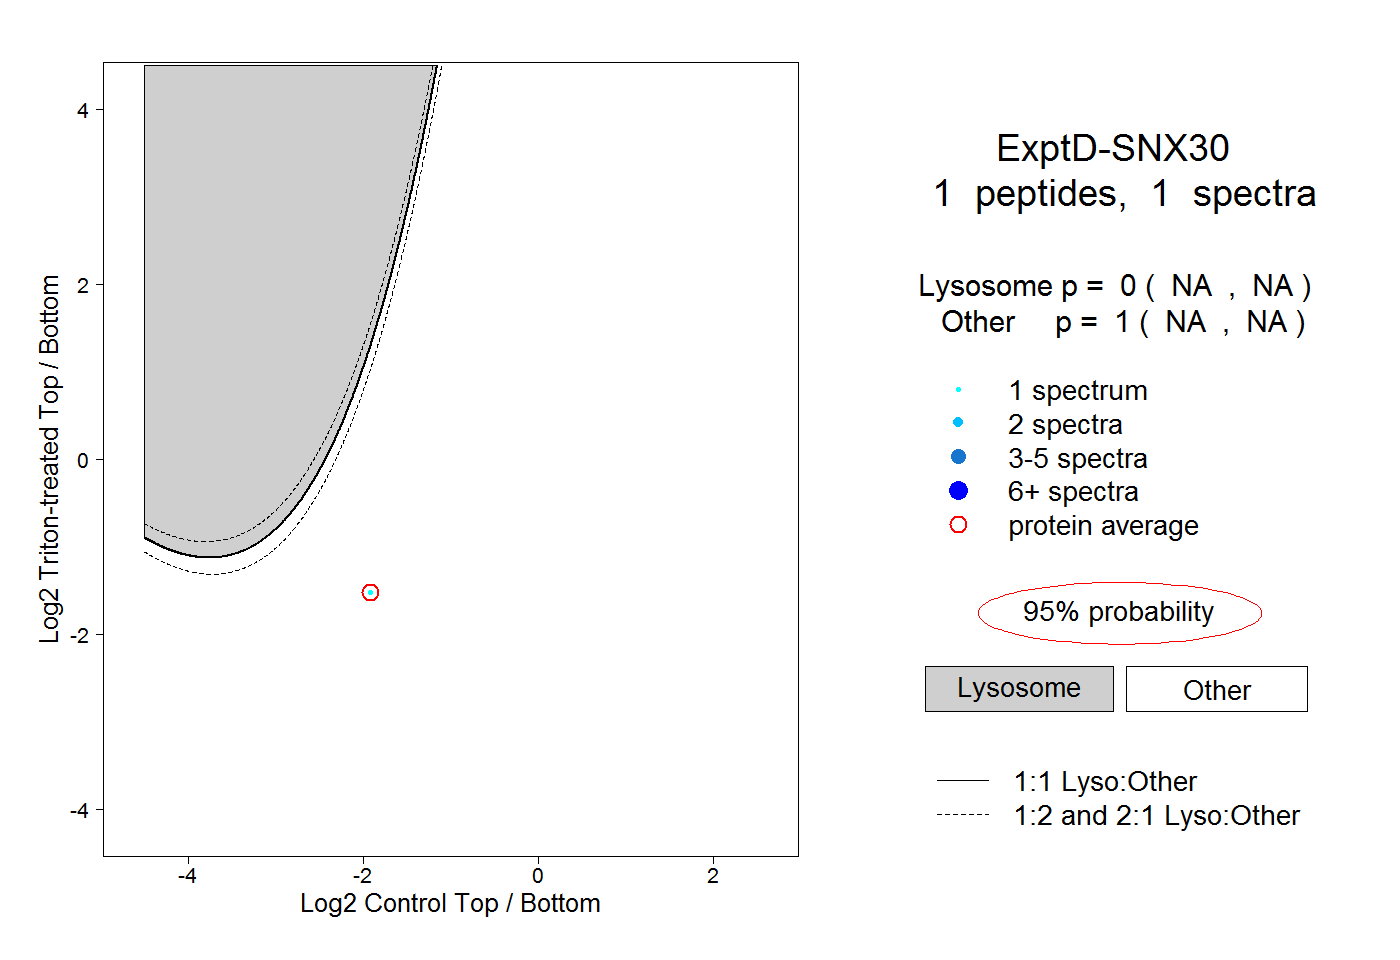 |
0.000 NA | NA |
1.000 NA | NA |