 14
14peptides
spectra
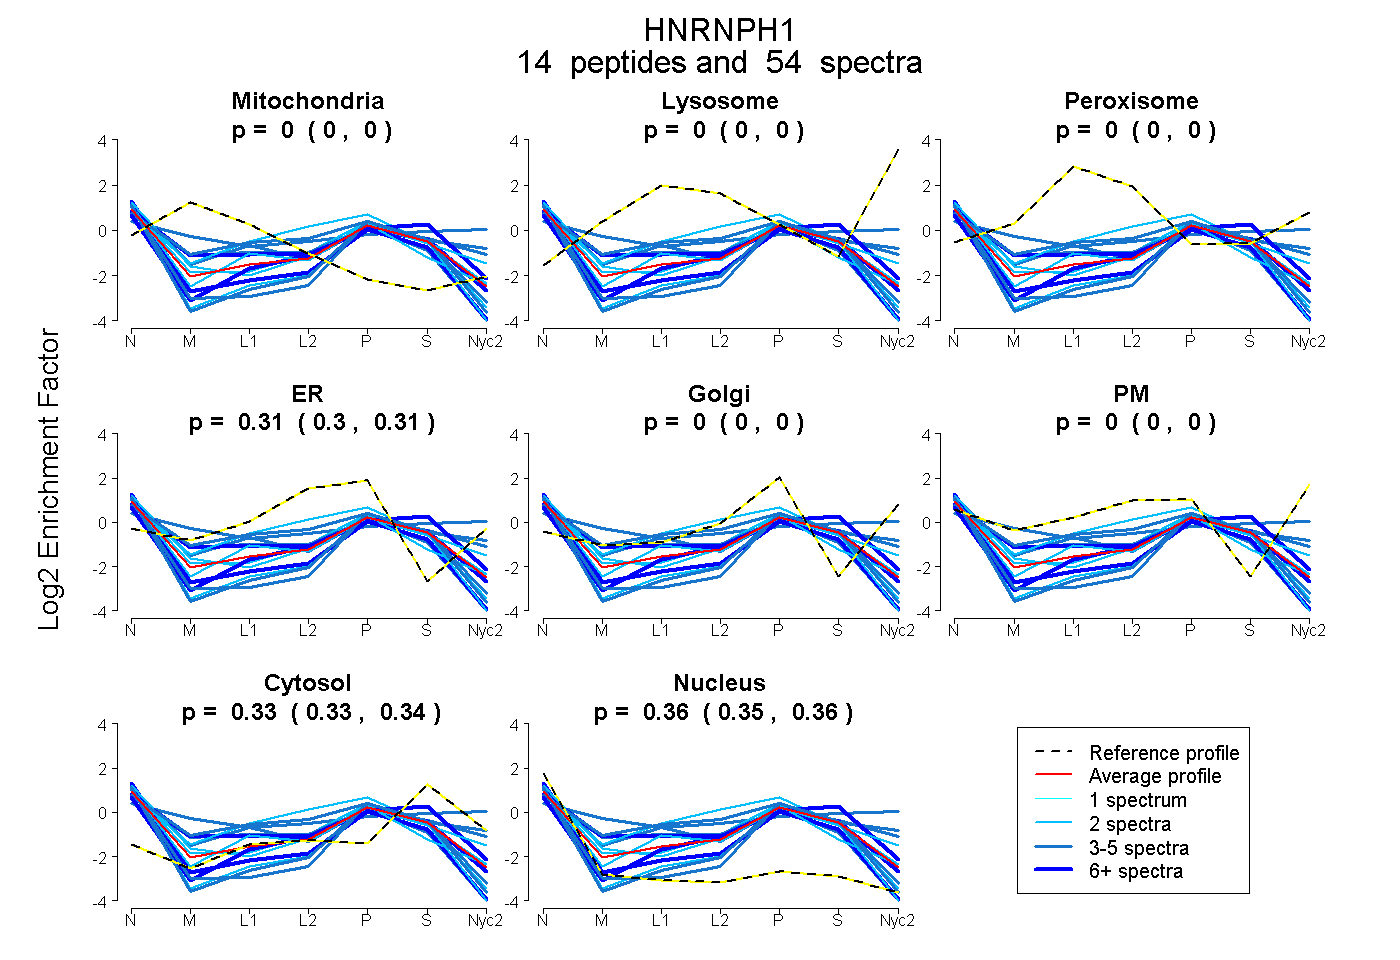
0.000 | 0.000
0.000 | 0.000
0.000 | 0.000
0.302 | 0.314
0.000 | 0.000
0.000 | 0.000
0.327 | 0.339
0.350 | 0.365
2peptides
spectra
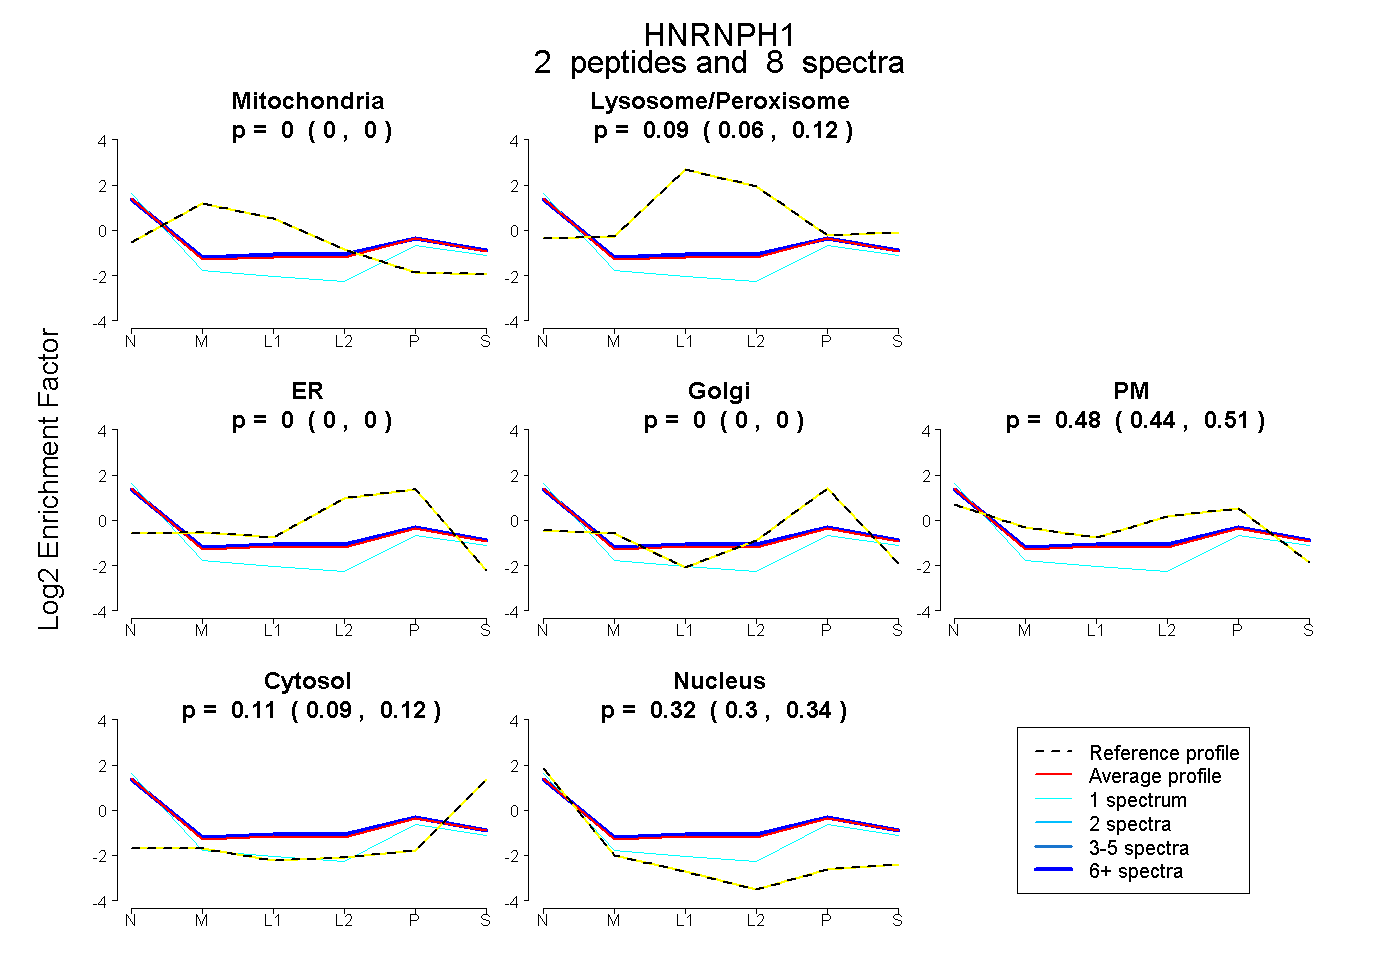
0.000 | 0.000
0.056 | 0.122
0.000 | 0.000
0.000 | 0.000
0.440 | 0.515
0.090 | 0.122
0.298 | 0.339
1peptide
spectra
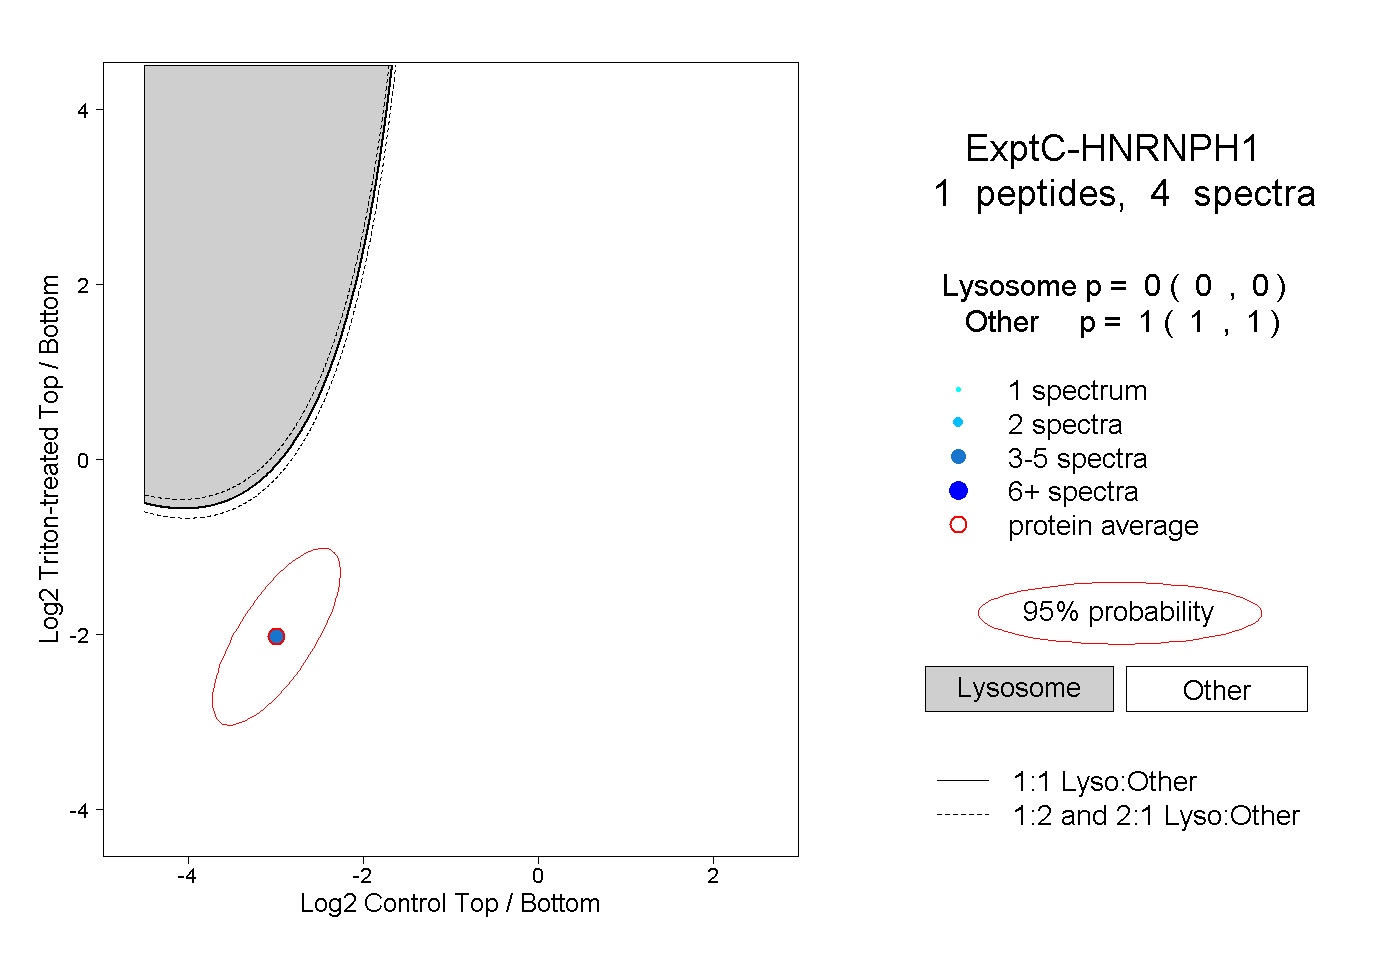
0.000 | 0.000
1.000 | 1.000
1peptide
spectra
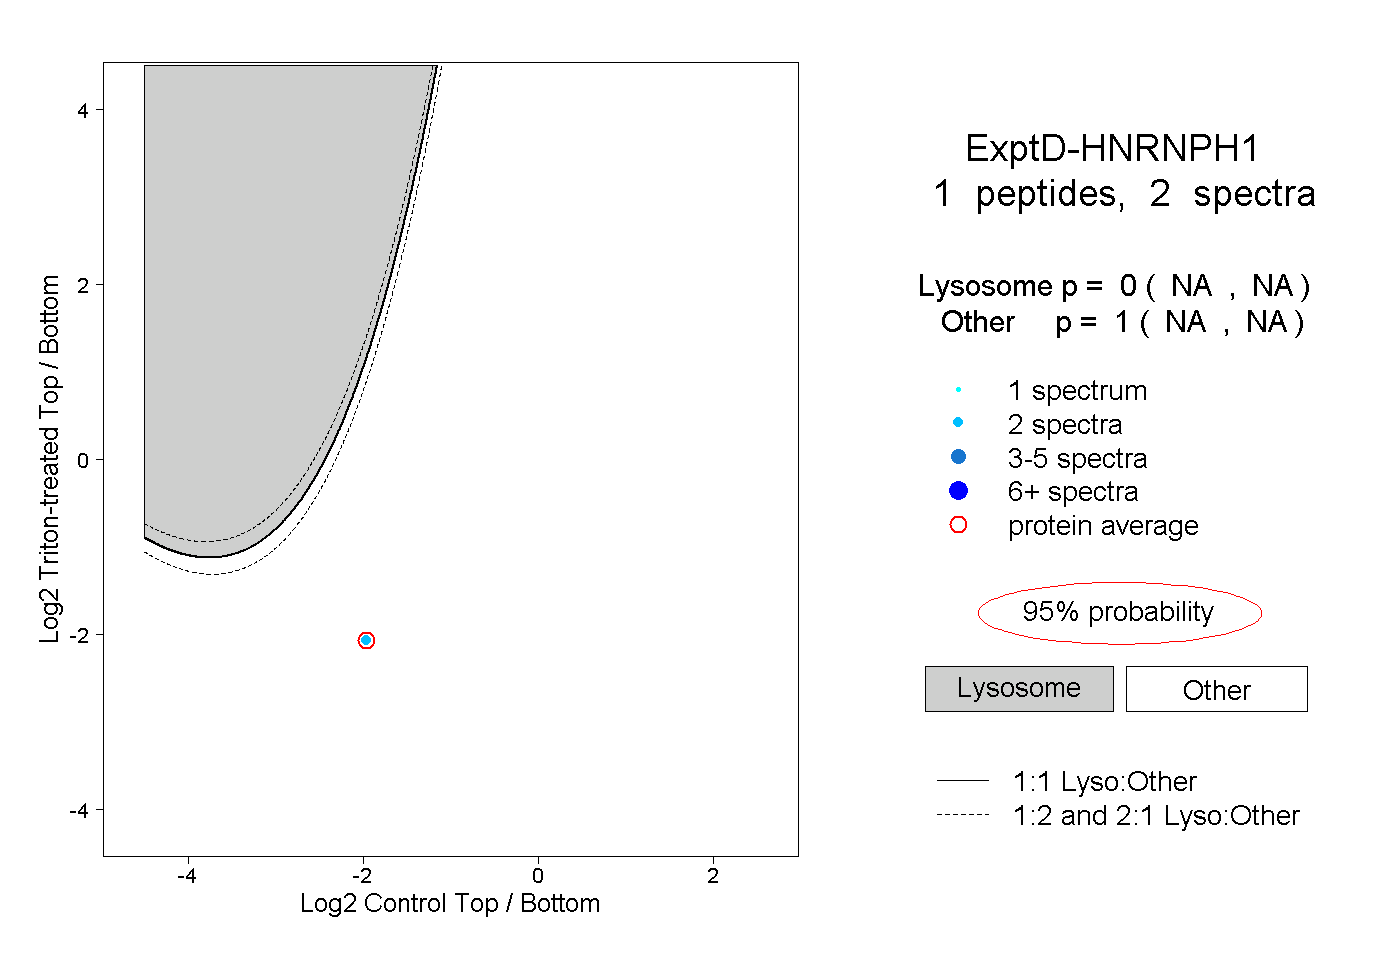
NA | NA
NA | NA