 14
14peptides
spectra
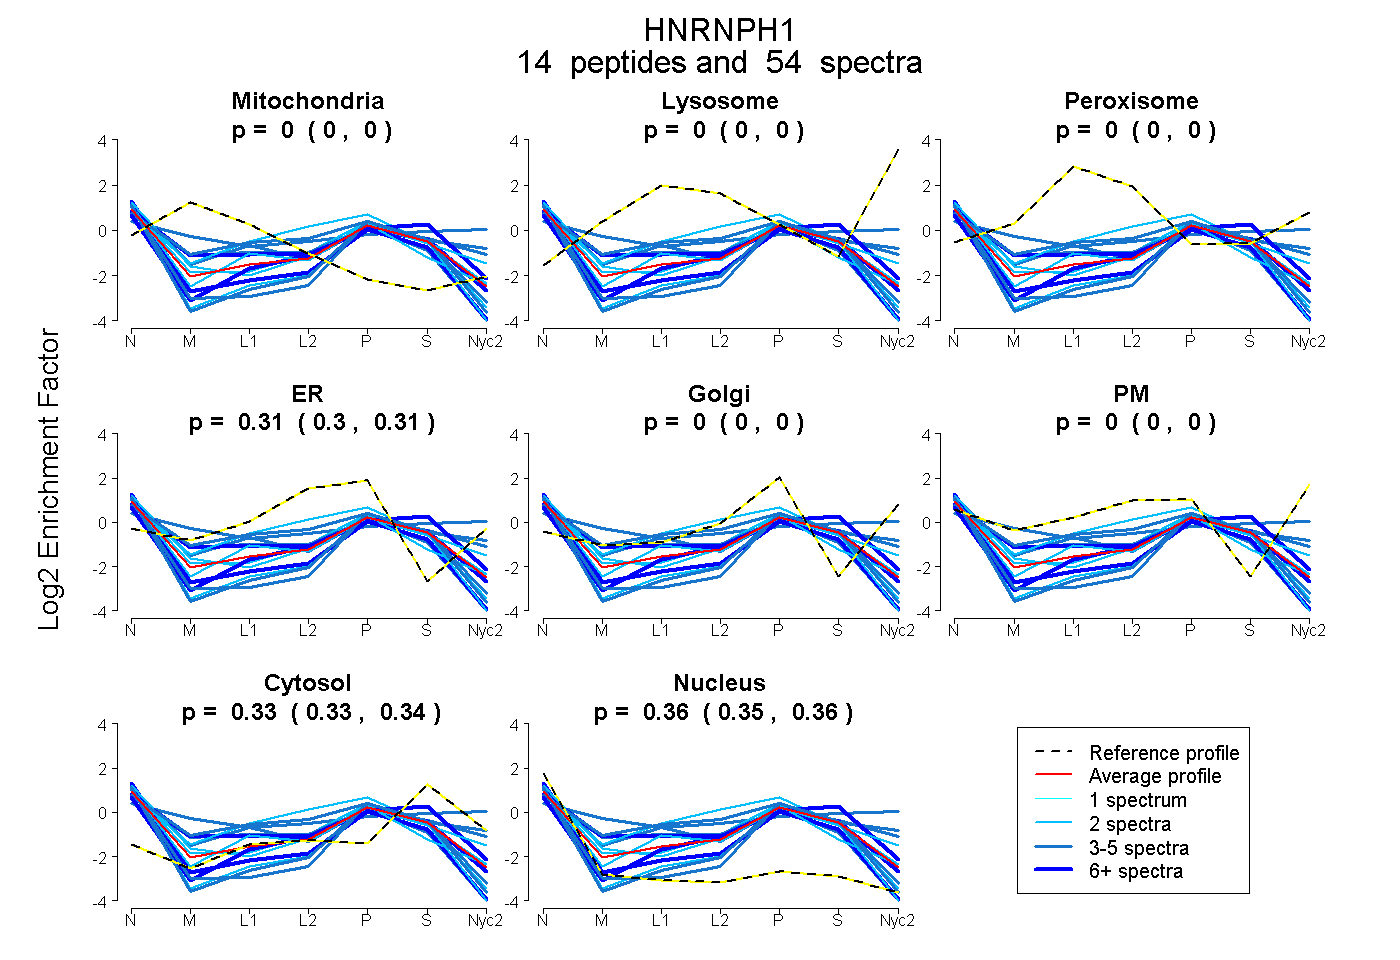
0.000 | 0.000
0.000 | 0.000
0.000 | 0.000
0.302 | 0.314
0.000 | 0.000
0.000 | 0.000
0.327 | 0.339
0.350 | 0.365
| Plot | Mito | Lyso | Perox | ER | Golgi | PM | Cytosol | Nucleus | |||||
| Expt A |
14 peptides |
54 spectra |
|
0.000 0.000 | 0.000 |
0.000 0.000 | 0.000 |
0.000 0.000 | 0.000 |
0.308 0.302 | 0.314 |
0.000 0.000 | 0.000 |
0.000 0.000 | 0.000 |
0.334 0.327 | 0.339 |
0.358 0.350 | 0.365 |
| 8 spectra, HTGPNSPDTANDGFVR | 0.104 | 0.000 | 0.000 | 0.300 | 0.000 | 0.000 | 0.315 | 0.281 | ||
| 3 spectra, DLNYCFSGMSDHR | 0.150 | 0.000 | 0.000 | 0.000 | 0.000 | 0.421 | 0.429 | 0.000 | ||
| 2 spectra, STGEAFVQFASQEIAEK | 0.000 | 0.000 | 0.064 | 0.476 | 0.000 | 0.000 | 0.241 | 0.219 | ||
| 5 spectra, GLPFGCSK | 0.000 | 0.000 | 0.115 | 0.046 | 0.205 | 0.091 | 0.318 | 0.226 | ||
| 4 spectra, YVEVFK | 0.000 | 0.000 | 0.000 | 0.000 | 0.117 | 0.000 | 0.316 | 0.566 | ||
| 4 spectra, THYDPPR | 0.000 | 0.000 | 0.093 | 0.229 | 0.000 | 0.216 | 0.310 | 0.153 | ||
| 3 spectra, FFSDCK | 0.074 | 0.000 | 0.013 | 0.315 | 0.000 | 0.000 | 0.148 | 0.450 | ||
| 2 spectra, VTGEADVEFATHEDAVAAMSK | 0.000 | 0.000 | 0.000 | 0.190 | 0.133 | 0.039 | 0.342 | 0.296 | ||
| 5 spectra, YIEIFK | 0.000 | 0.000 | 0.000 | 0.066 | 0.077 | 0.000 | 0.342 | 0.515 | ||
| 2 spectra, SNNVEMDWVLK | 0.000 | 0.000 | 0.000 | 0.128 | 0.000 | 0.000 | 0.295 | 0.576 | ||
| 2 spectra, ETMGHR | 0.000 | 0.000 | 0.000 | 0.318 | 0.000 | 0.000 | 0.261 | 0.421 | ||
| 6 spectra, GLPWSCSADEVQR | 0.000 | 0.000 | 0.000 | 0.182 | 0.000 | 0.000 | 0.232 | 0.585 | ||
| 6 spectra, VHIEIGPDGR | 0.000 | 0.000 | 0.000 | 0.196 | 0.000 | 0.000 | 0.535 | 0.269 | ||
| 2 spectra, IQNGAQGIR | 0.000 | 0.000 | 0.000 | 0.333 | 0.063 | 0.000 | 0.162 | 0.442 |
| Plot | Mito | Lyso or Perox | ER | Golgi | PM | Cytosol | Nucleus | ||||||
| Expt B |
2 peptides |
8 spectra |
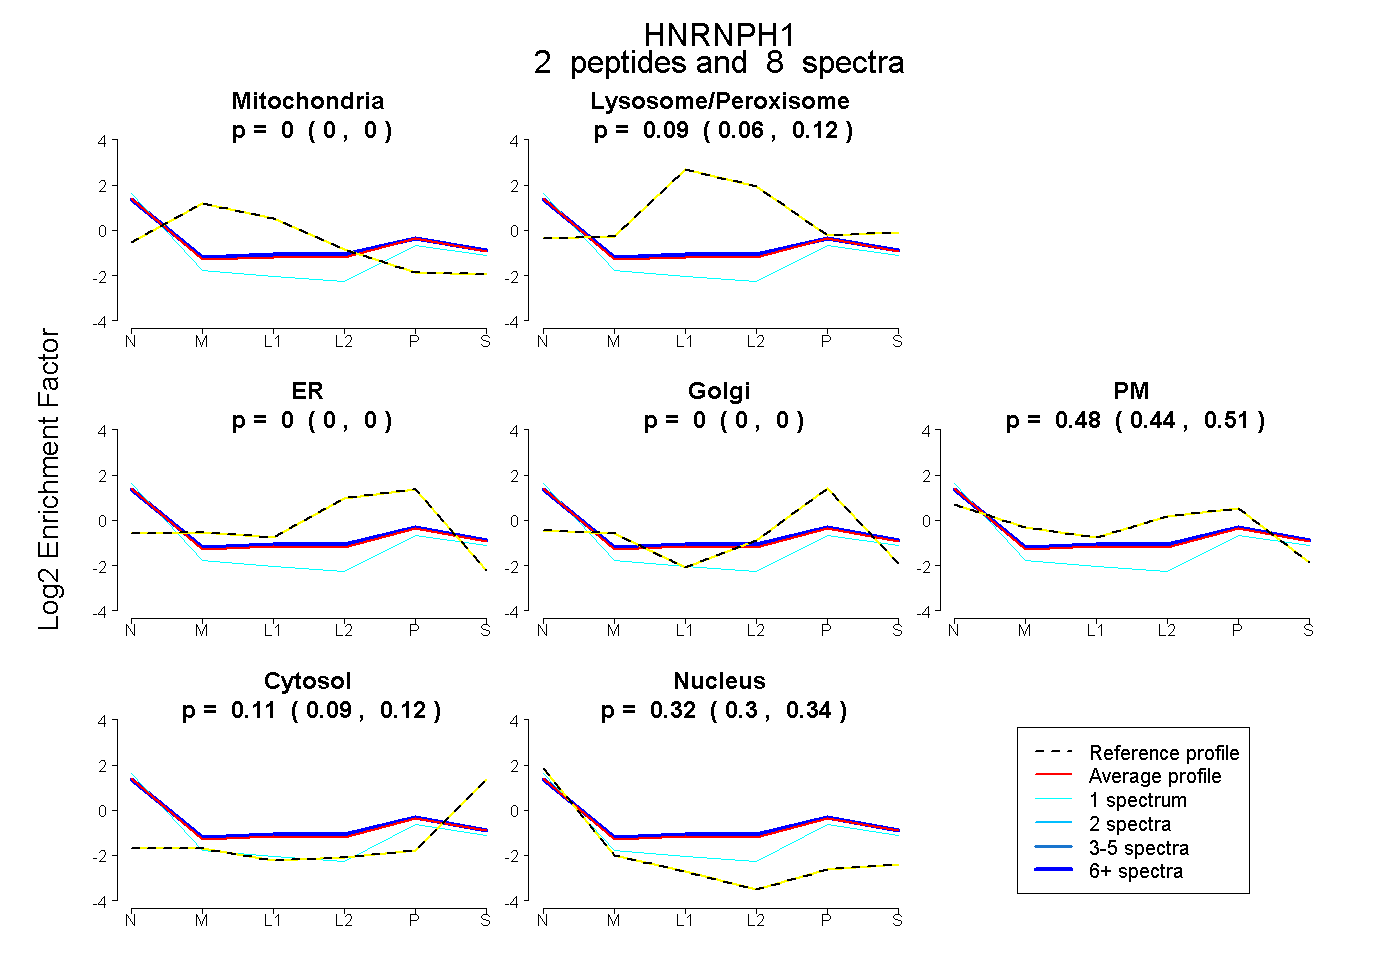 |
0.000 0.000 | 0.000 |
0.093 0.056 | 0.122 |
0.000 0.000 | 0.000 |
0.000 0.000 | 0.000 |
0.479 0.440 | 0.515 |
0.107 0.090 | 0.122 |
0.320 0.298 | 0.339 |
|||
| Plot | Lyso | Other | |||||||||||
| Expt C |
1 peptide |
4 spectra |
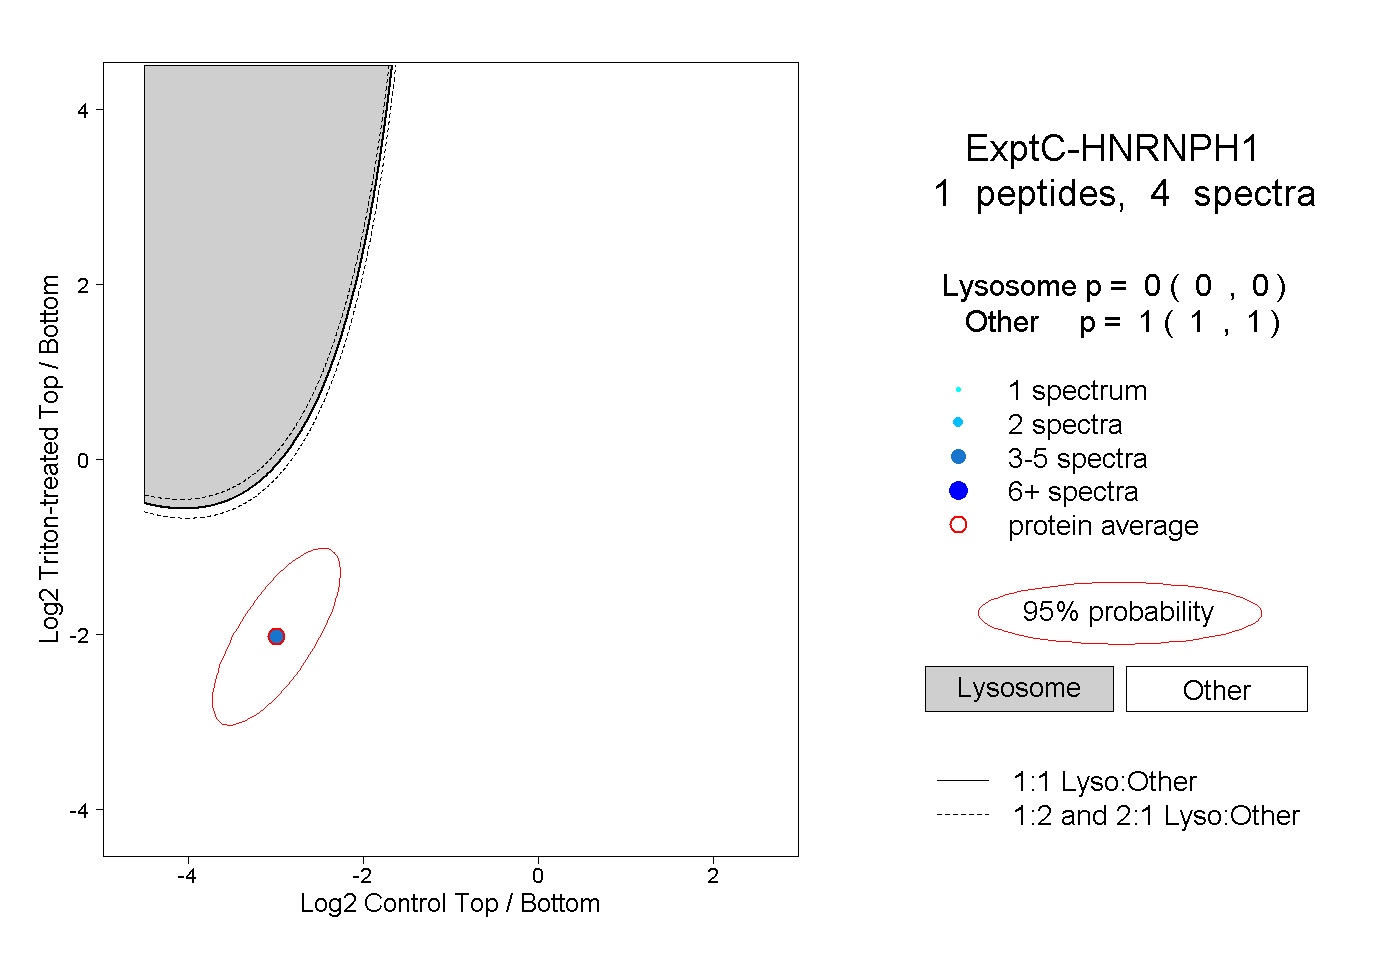 |
0.000 0.000 | 0.000 |
1.000 1.000 | 1.000 |
||||||||
| Plot | Lyso | Other | |||||||||||
| Expt D |
1 peptide |
2 spectra |
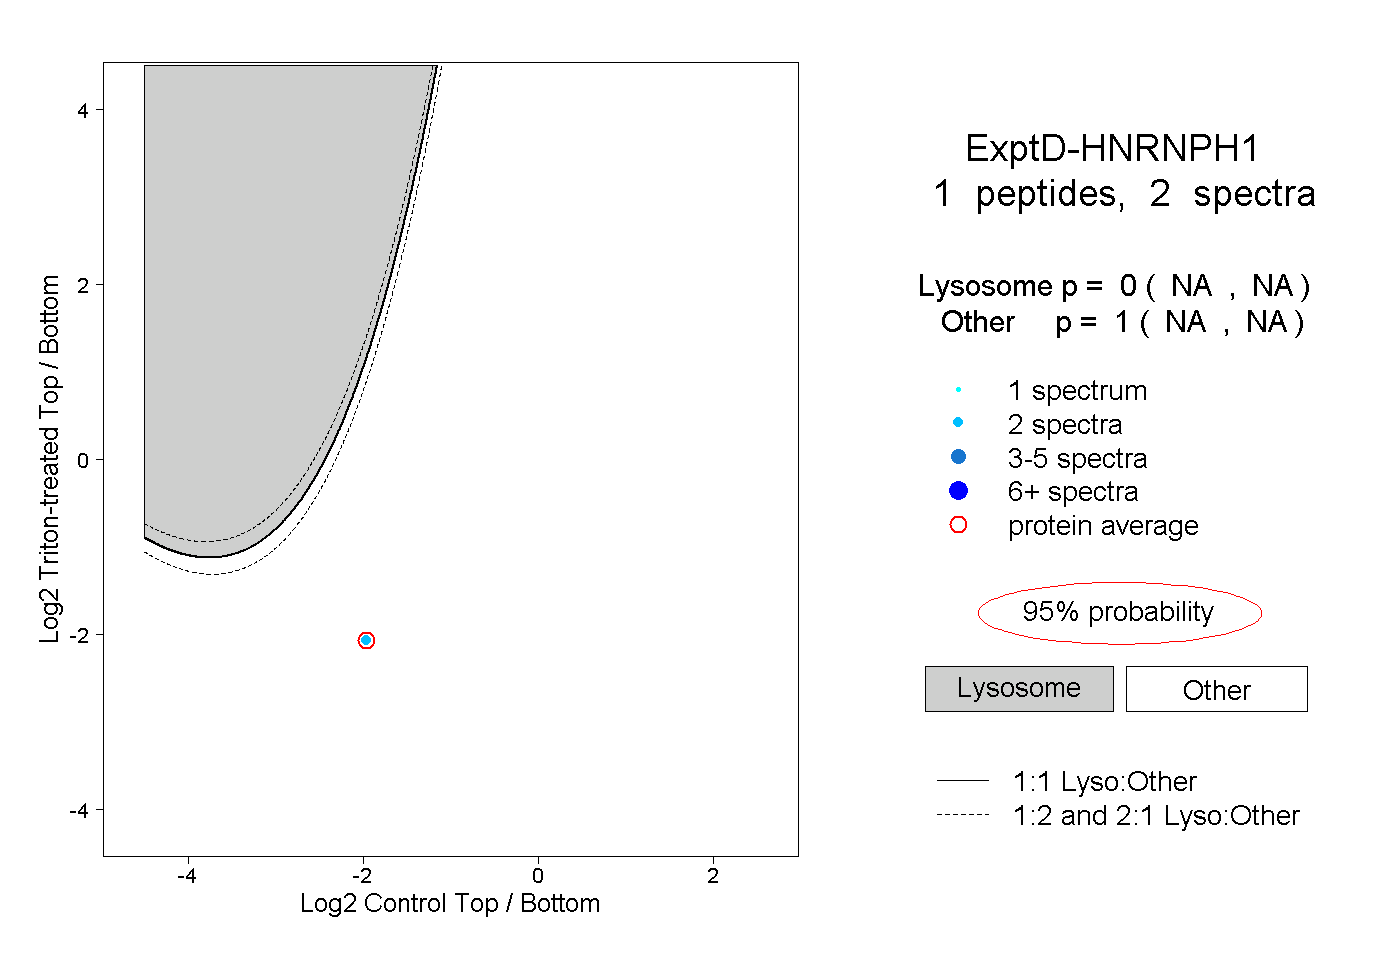 |
0.000 NA | NA |
1.000 NA | NA |