 2
2peptides
spectra
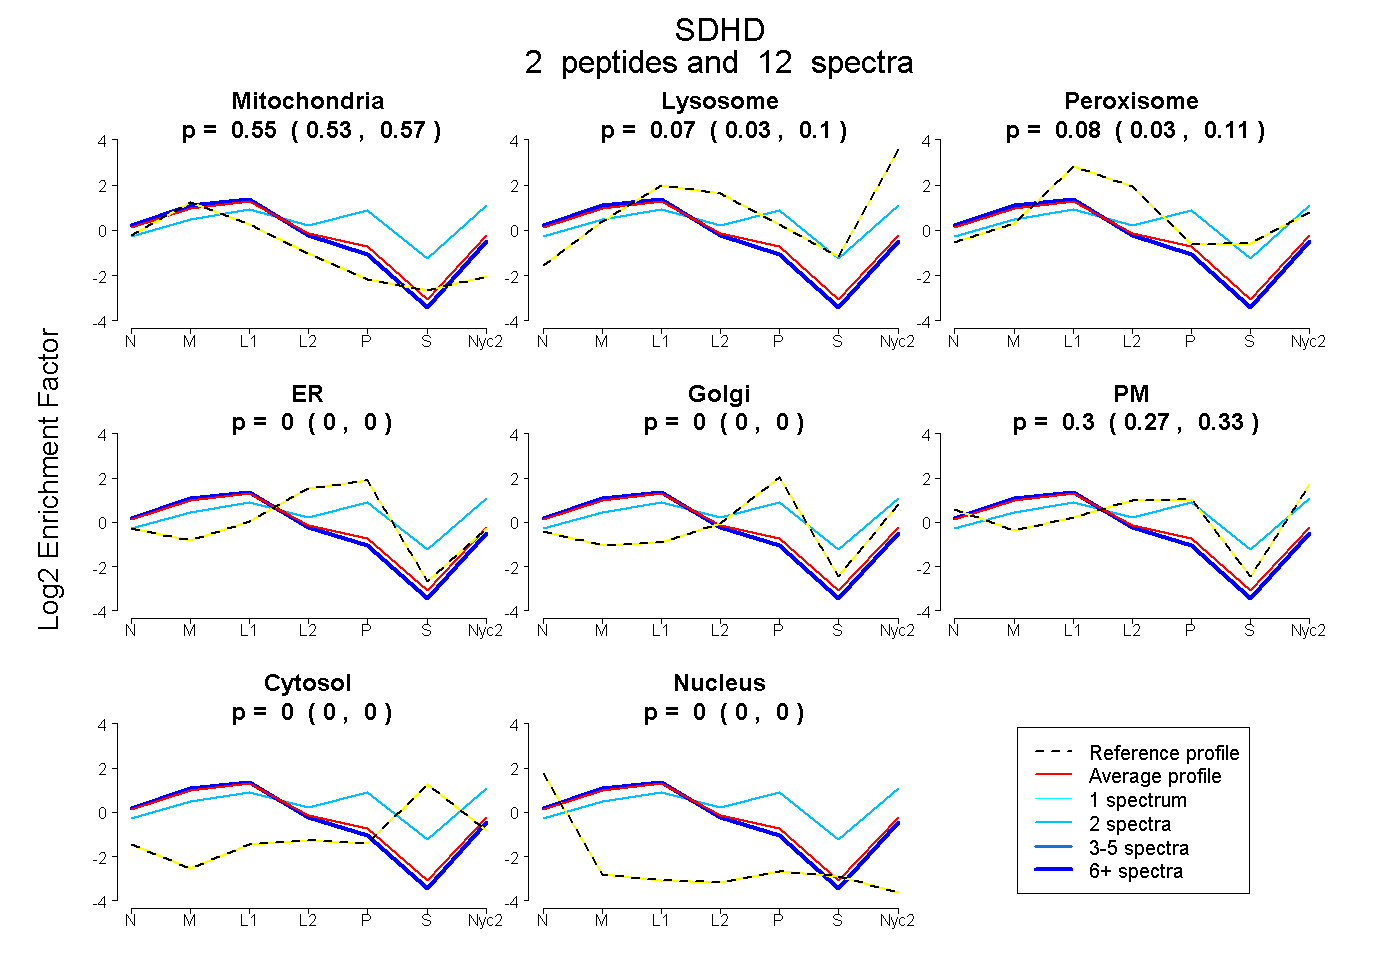
0.529 | 0.569
0.034 | 0.104
0.034 | 0.111
0.000 | 0.000
0.000 | 0.000
0.269 | 0.328
0.000 | 0.000
0.000 | 0.000
1peptide
spectrum
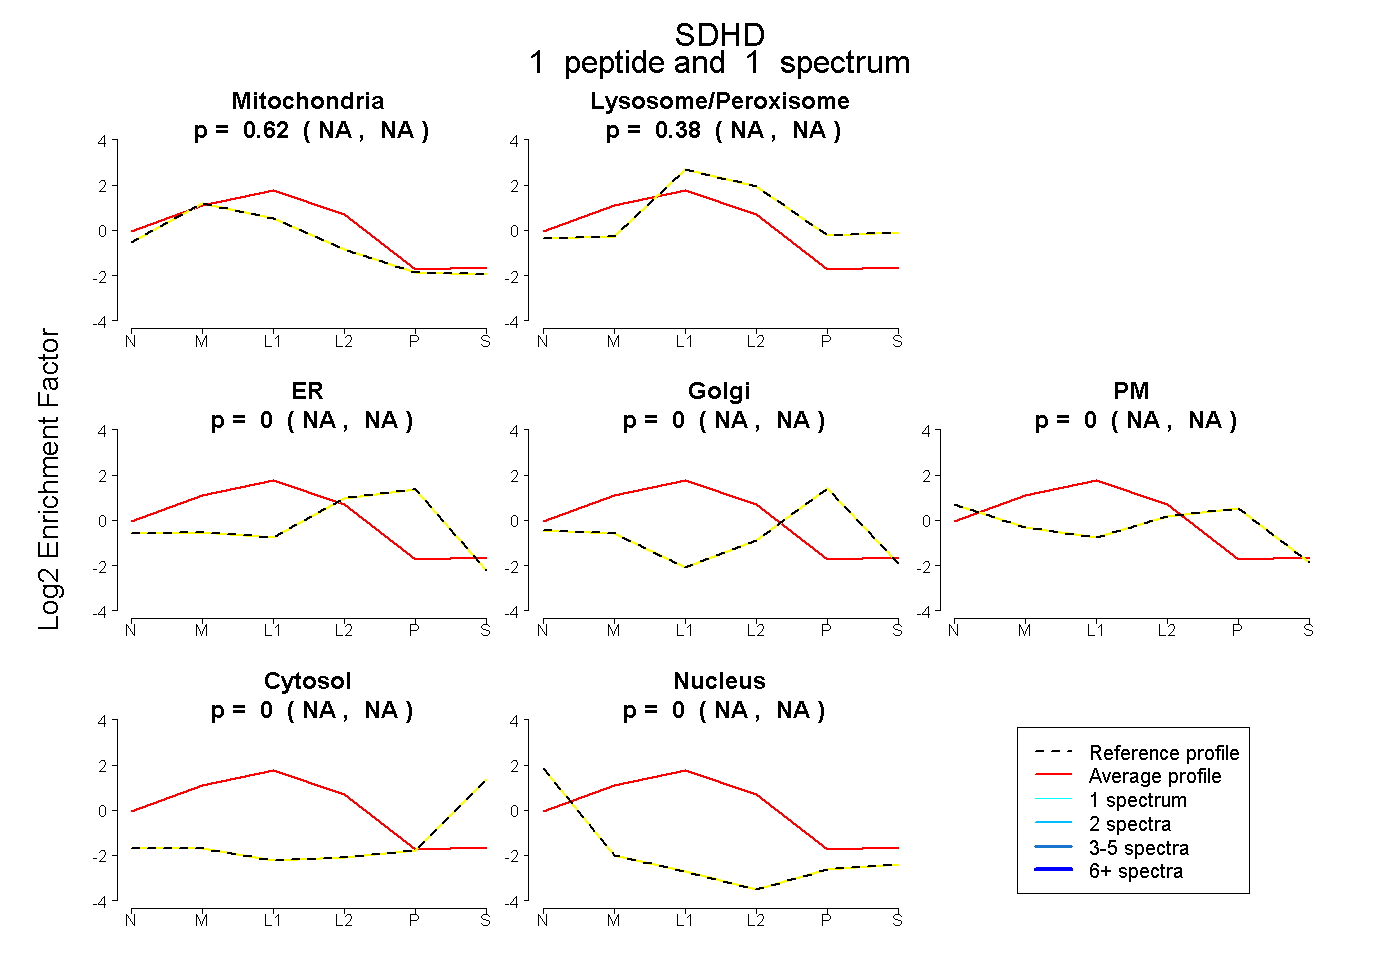
NA | NA
NA | NA
NA | NA
NA | NA
NA | NA
NA | NA
NA | NA
1peptide
spectra
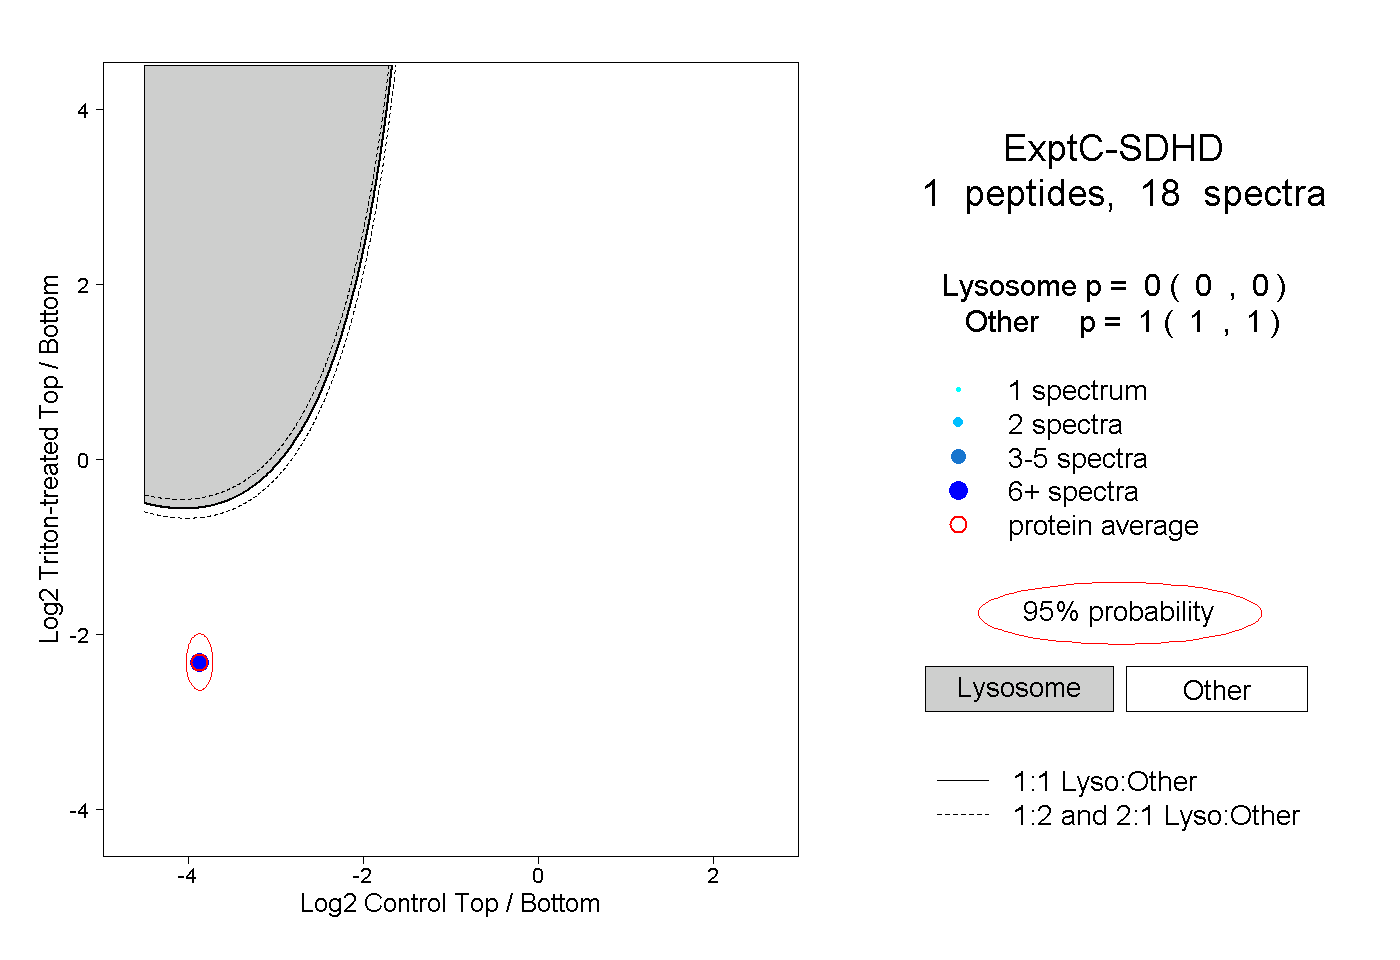
0.000 | 0.000
1.000 | 1.000