 2
2peptides
spectra
0.529 | 0.569
0.034 | 0.104
0.034 | 0.111
0.000 | 0.000
0.000 | 0.000
0.269 | 0.328
0.000 | 0.000
0.000 | 0.000
| Plot | Mito | Lyso | Perox | ER | Golgi | PM | Cytosol | Nucleus | |||||
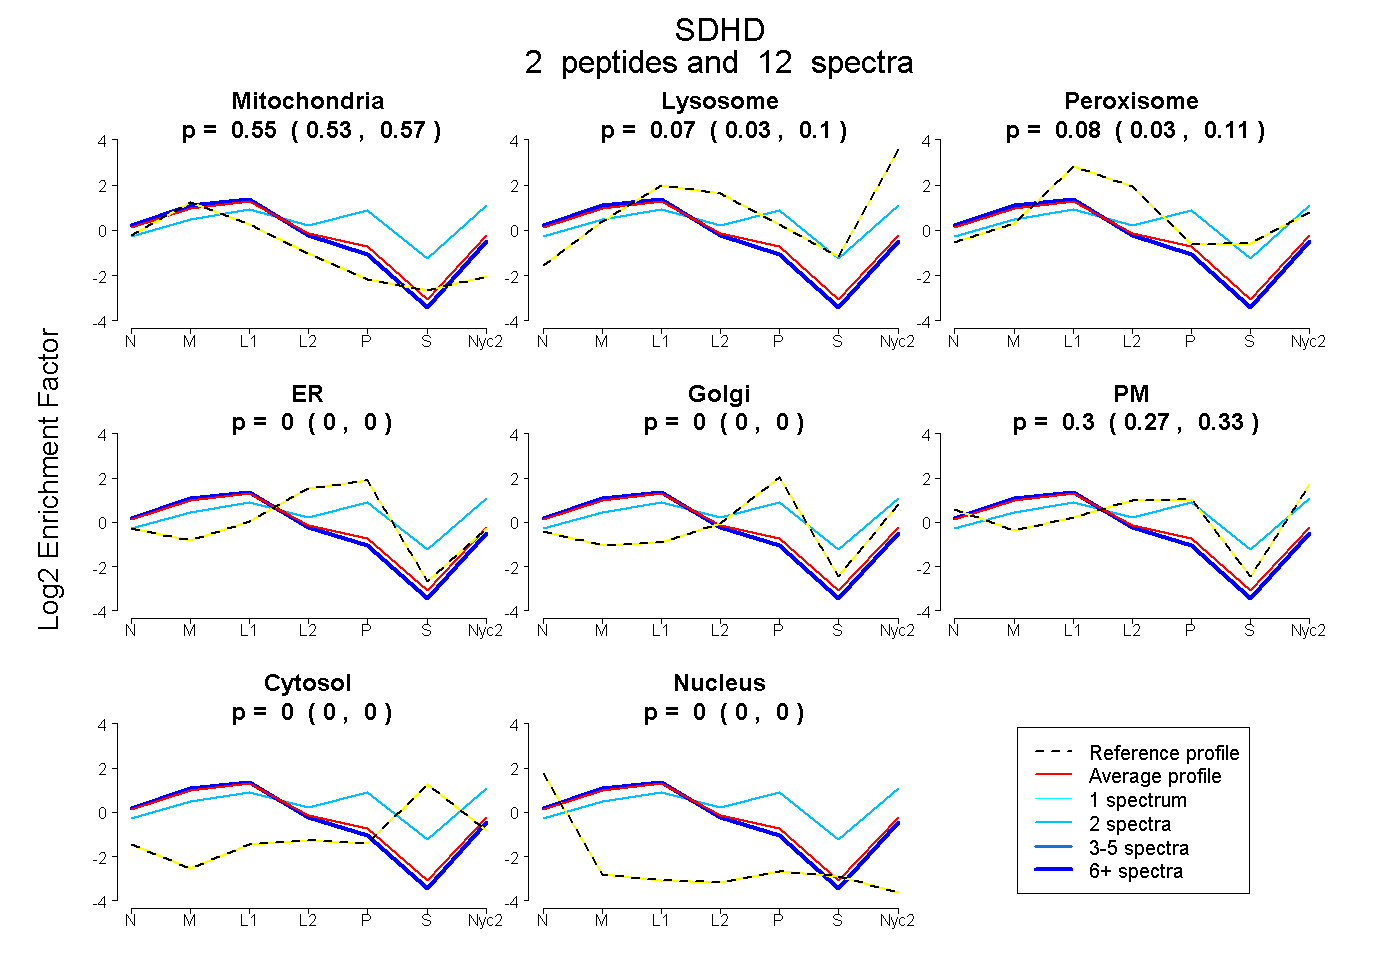
| Expt A |
2 peptides |
12 spectra |
|
0.552 0.529 | 0.569 |
0.073 0.034 | 0.104 |
0.075 0.034 | 0.111 |
0.000 0.000 | 0.000 |
0.000 0.000 | 0.000 |
0.300 0.269 | 0.328 |
0.000 0.000 | 0.000 |
0.000 0.000 | 0.000 |
| 2 spectra, AASLHWTSER | 0.120 | 0.204 | 0.259 | 0.000 | 0.413 | 0.004 | 0.000 | 0.000 | ||
| 10 spectra, AVAMLWK | 0.625 | 0.044 | 0.067 | 0.000 | 0.000 | 0.264 | 0.000 | 0.000 |
| Plot | Mito | Lyso or Perox | ER | Golgi | PM | Cytosol | Nucleus | ||||||
| Expt B |
1 peptide |
1 spectrum |
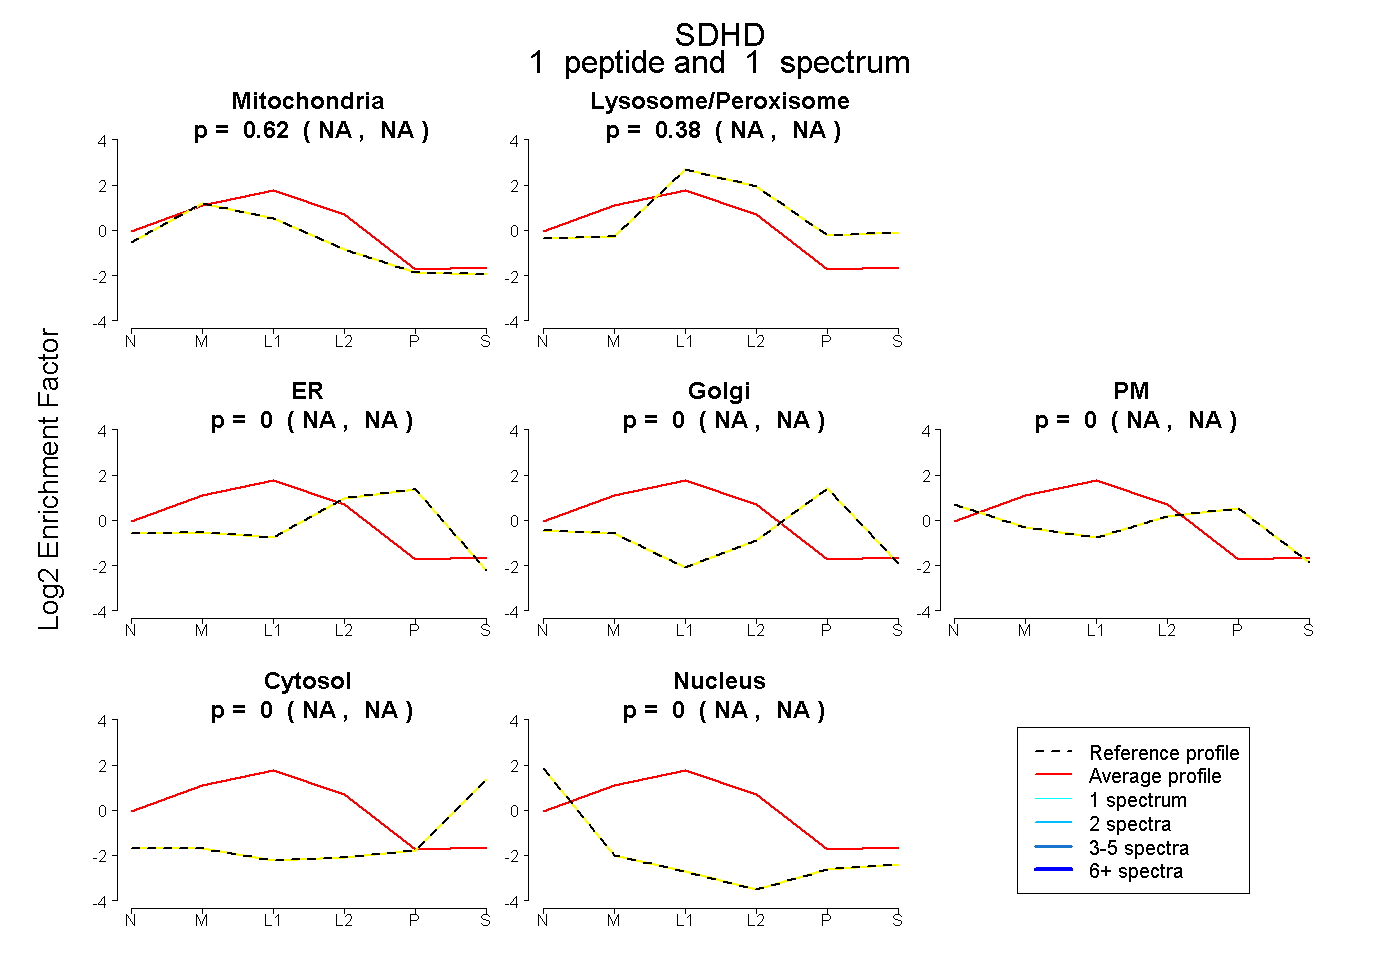 |
0.621 NA | NA |
0.379 NA | NA |
0.000 NA | NA |
0.000 NA | NA |
0.000 NA | NA |
0.000 NA | NA |
0.000 NA | NA |
|||
| Plot | Lyso | Other | |||||||||||
| Expt C |
1 peptide |
18 spectra |
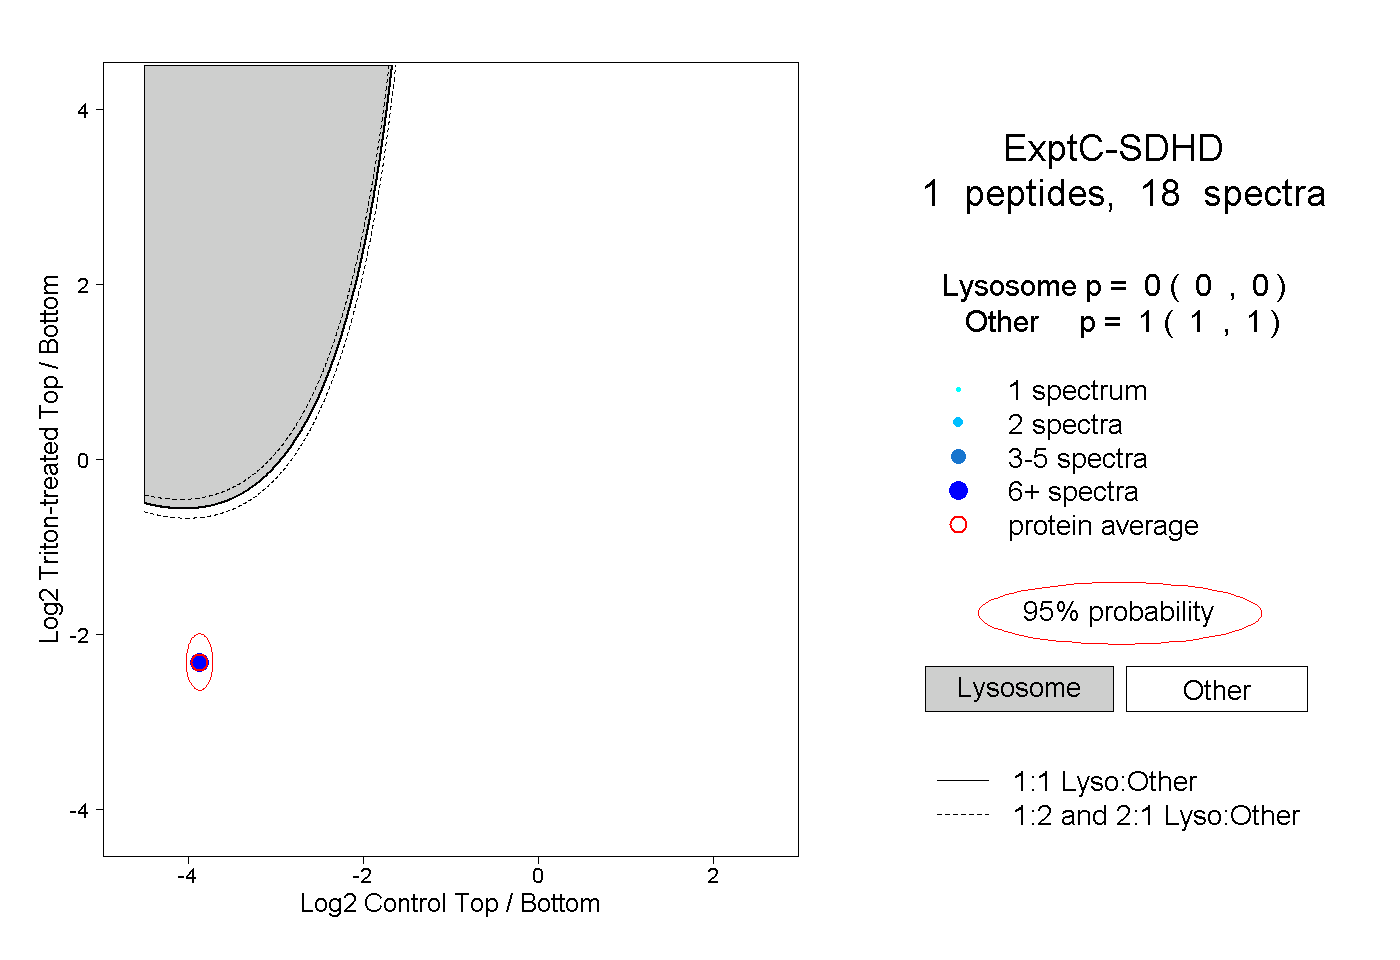 |
0.000 0.000 | 0.000 |
1.000 1.000 | 1.000 |