 8
8peptides
spectra
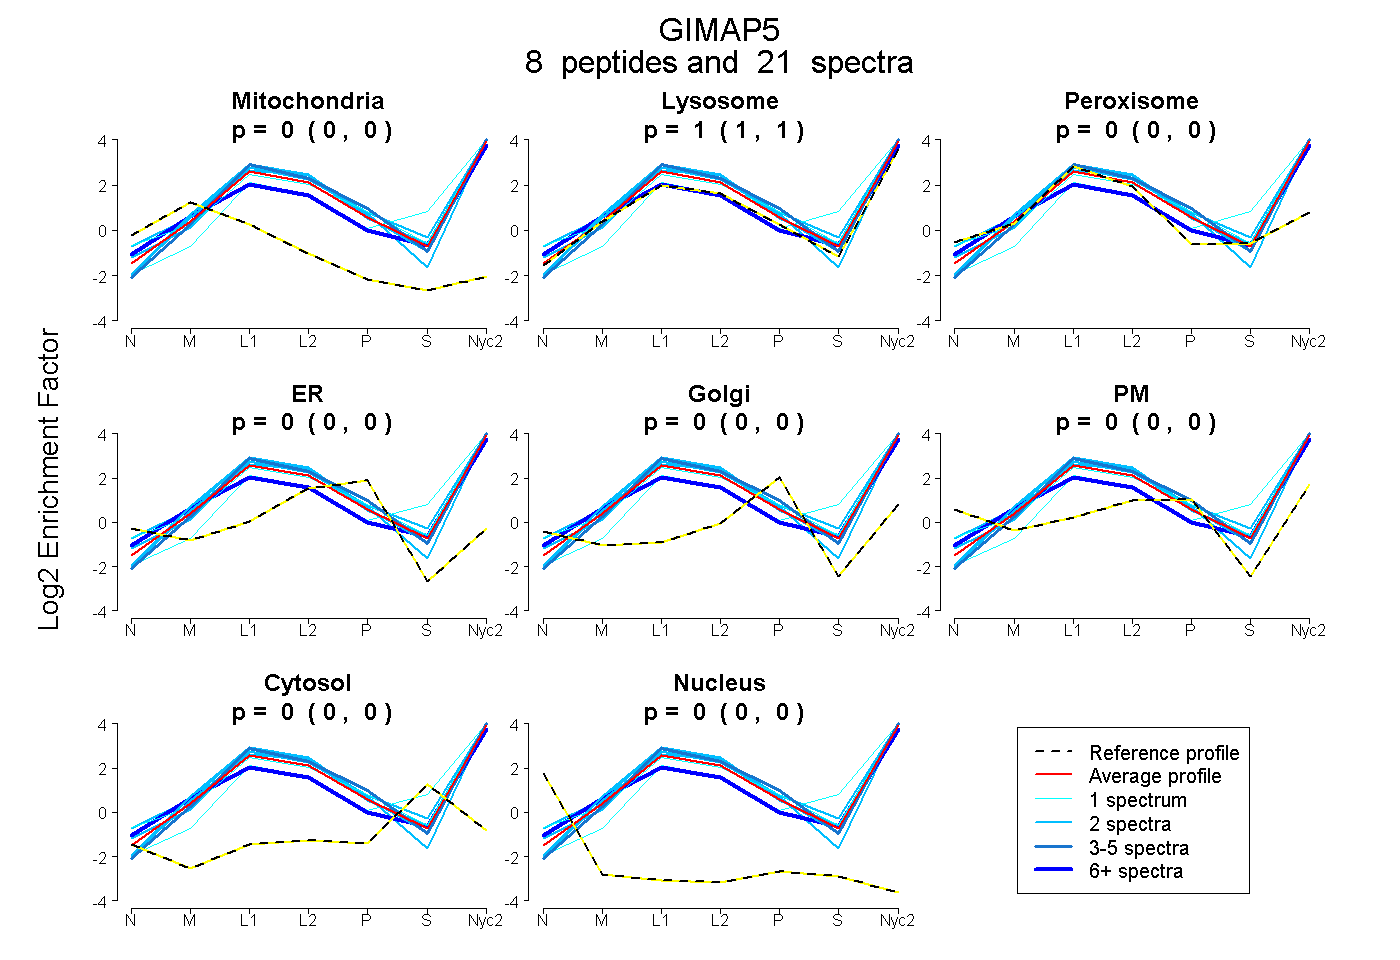
0.000 | 0.000
1.000 | 1.000
0.000 | 0.000
0.000 | 0.000
0.000 | 0.000
0.000 | 0.000
0.000 | 0.000
0.000 | 0.000
12peptides
spectra
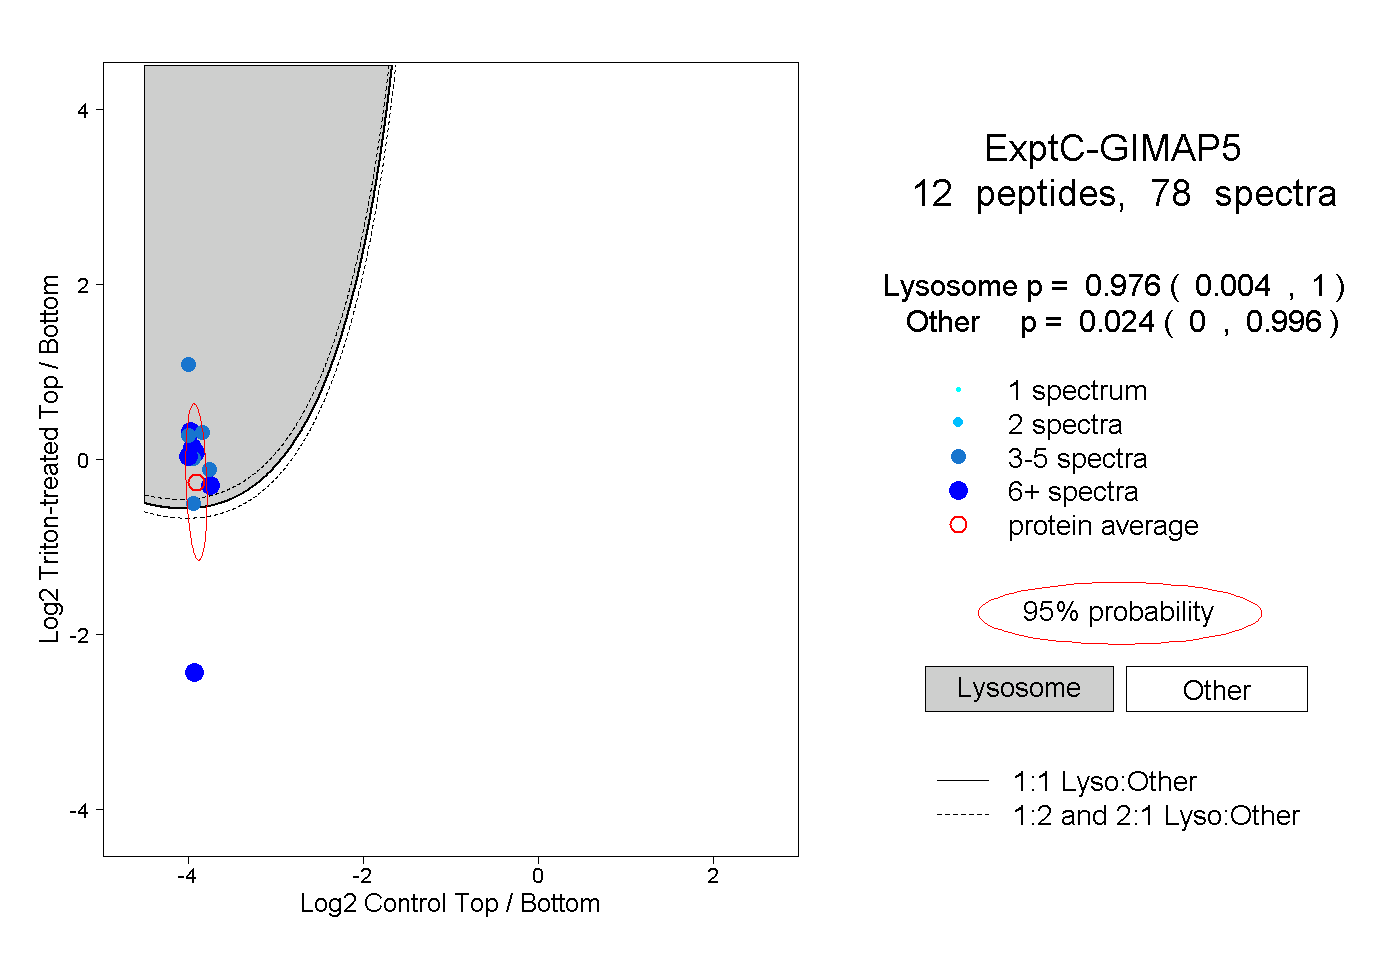
0.004 | 1.000
0.000 | 0.996
2peptides
spectra
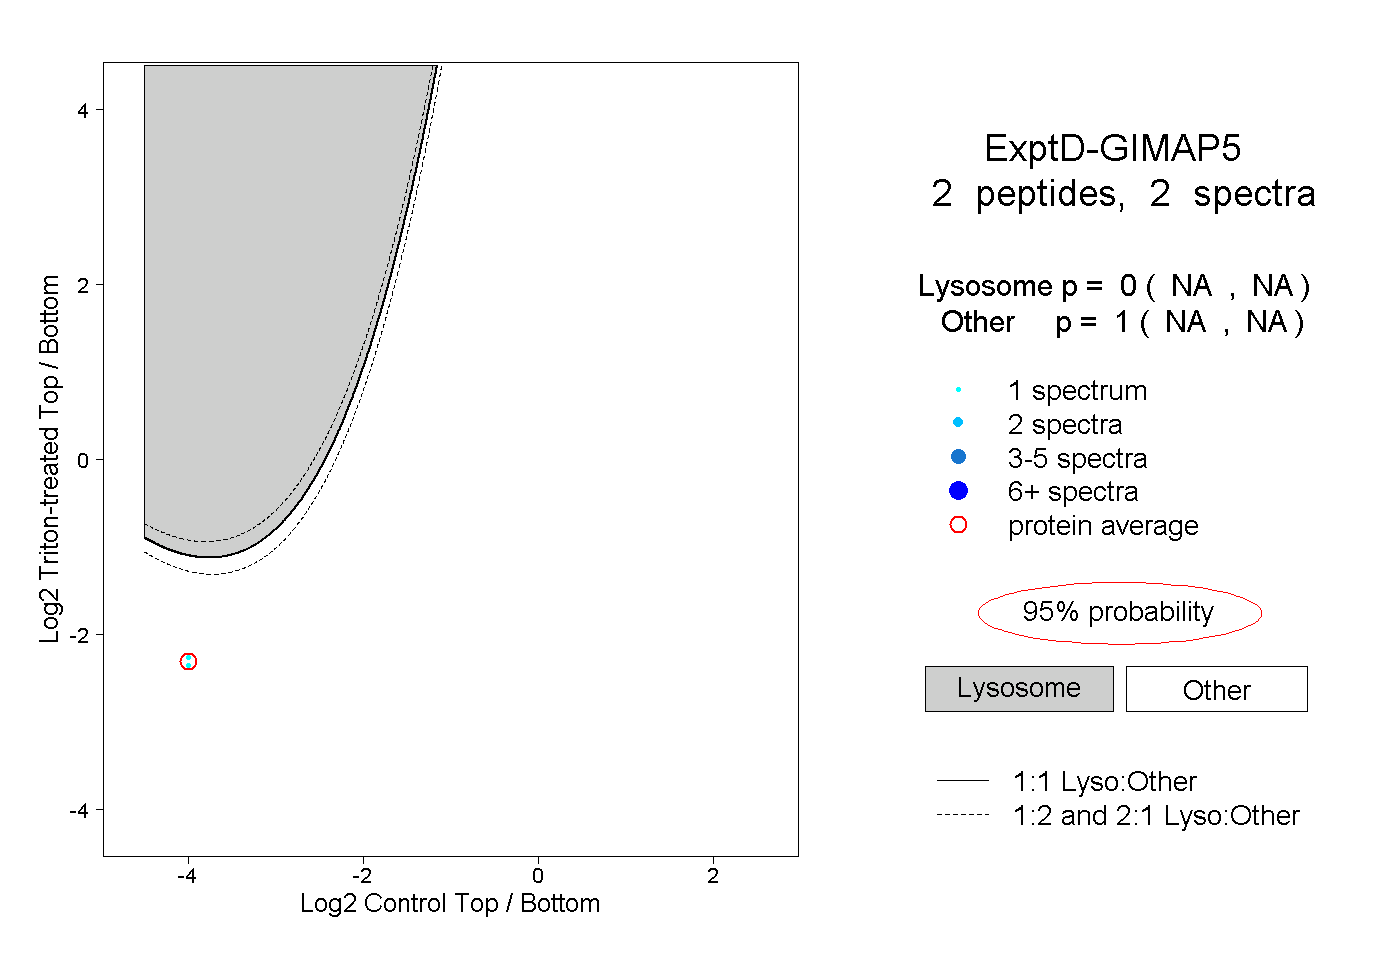
NA | NA
NA | NA