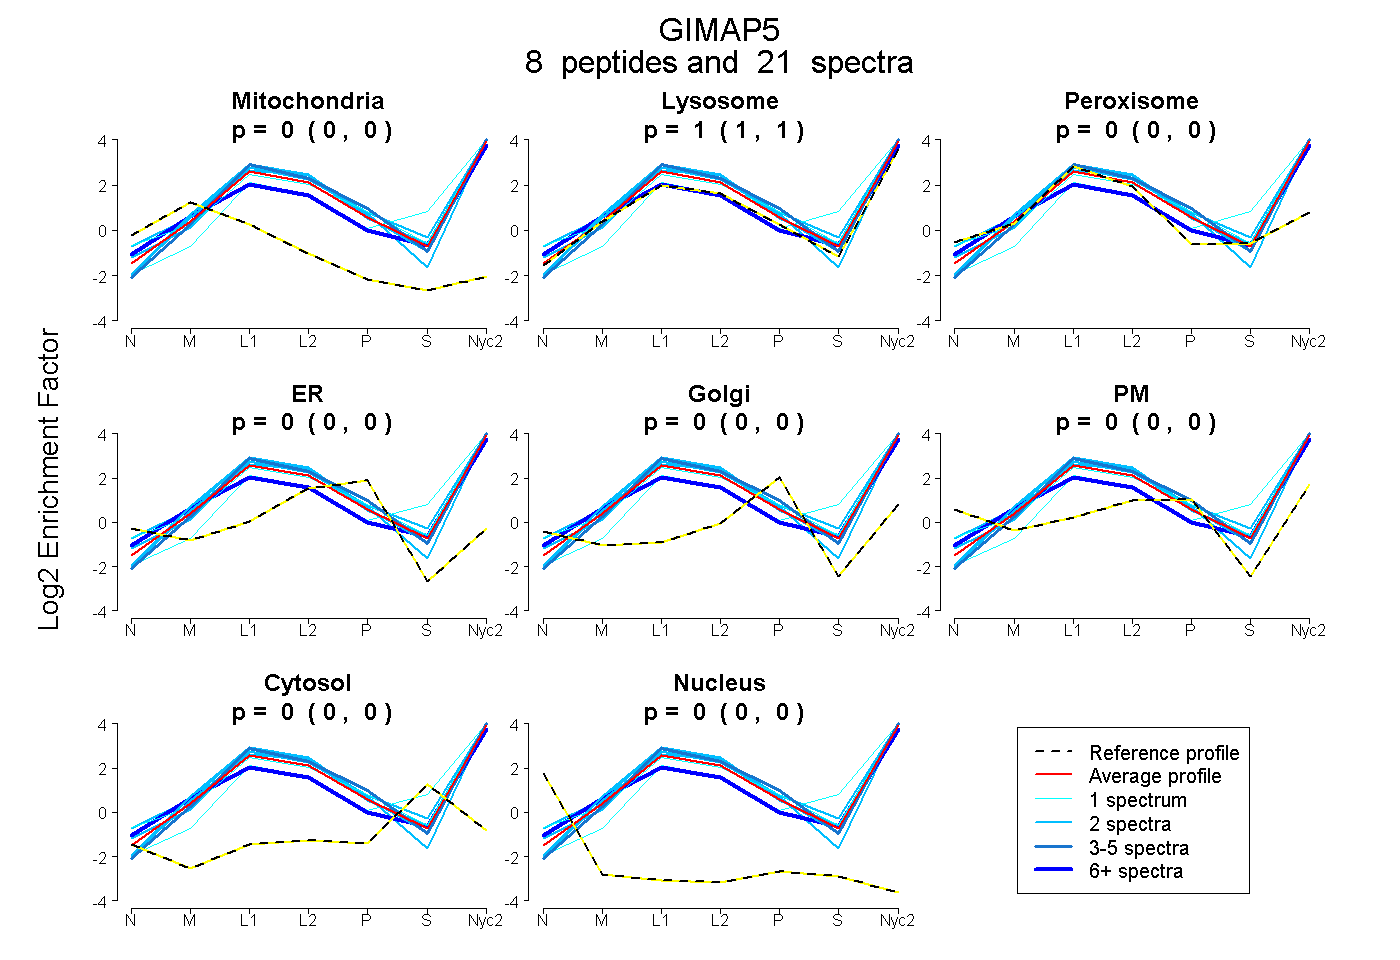
 8
8peptides
spectra
0.000 | 0.000
1.000 | 1.000
0.000 | 0.000
0.000 | 0.000
0.000 | 0.000
0.000 | 0.000
0.000 | 0.000
0.000 | 0.000
| Plot | Mito | Lyso | Perox | ER | Golgi | PM | Cytosol | Nucleus | |||||
| Expt A |
8 peptides |
21 spectra |
|
0.000 0.000 | 0.000 |
1.000 1.000 | 1.000 |
0.000 0.000 | 0.000 |
0.000 0.000 | 0.000 |
0.000 0.000 | 0.000 |
0.000 0.000 | 0.000 |
0.000 0.000 | 0.000 |
0.000 0.000 | 0.000 |
| 2 spectra, GQSVTR | 0.000 | 0.996 | 0.004 | 0.000 | 0.000 | 0.000 | 0.000 | 0.000 | ||
| 6 spectra, QIFGVGVMR | 0.000 | 0.952 | 0.048 | 0.000 | 0.000 | 0.000 | 0.000 | 0.000 | ||
| 2 spectra, TSQAEMGTWEGR | 0.000 | 1.000 | 0.000 | 0.000 | 0.000 | 0.000 | 0.000 | 0.000 | ||
| 2 spectra, LVQECGR | 0.000 | 1.000 | 0.000 | 0.000 | 0.000 | 0.000 | 0.000 | 0.000 | ||
| 1 spectrum, IILVGK | 0.000 | 0.893 | 0.000 | 0.000 | 0.000 | 0.000 | 0.107 | 0.000 | ||
| 5 spectra, YTVEDAMAVR | 0.000 | 1.000 | 0.000 | 0.000 | 0.000 | 0.000 | 0.000 | 0.000 | ||
| 2 spectra, SATGNSILR | 0.000 | 1.000 | 0.000 | 0.000 | 0.000 | 0.000 | 0.000 | 0.000 | ||
| 1 spectrum, YCAFNNK | 0.000 | 0.999 | 0.001 | 0.000 | 0.000 | 0.000 | 0.000 | 0.000 |
| Plot | Lyso | Other | |||||||||||
| Expt C |
12 peptides |
78 spectra |
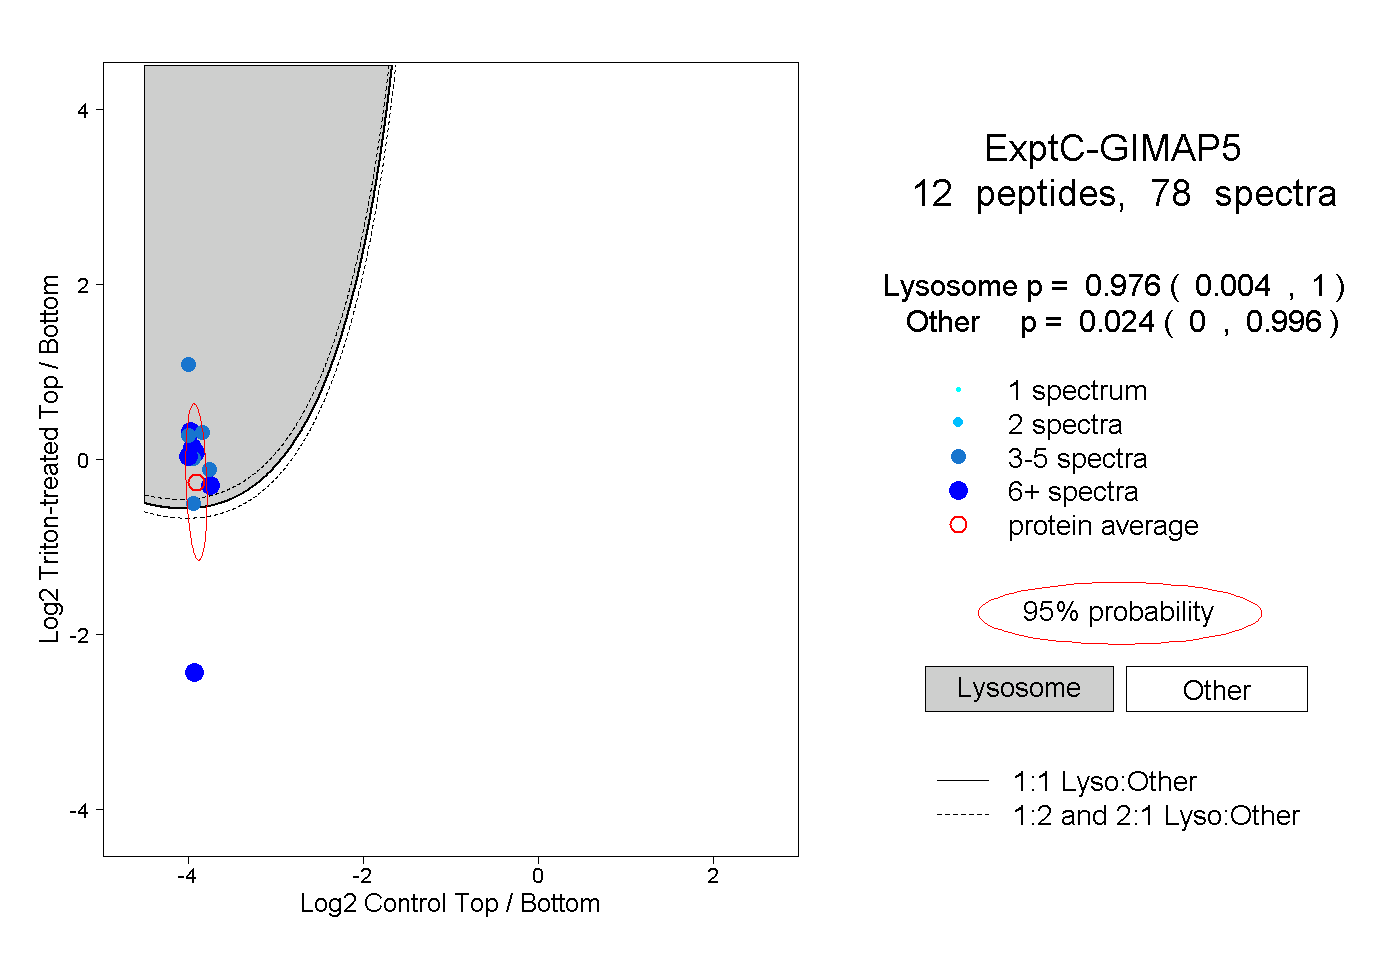 |
0.976 0.004 | 1.000 |
0.024 0.000 | 0.996 |
||||||||
| Plot | Lyso | Other | |||||||||||
| Expt D |
2 peptides |
2 spectra |
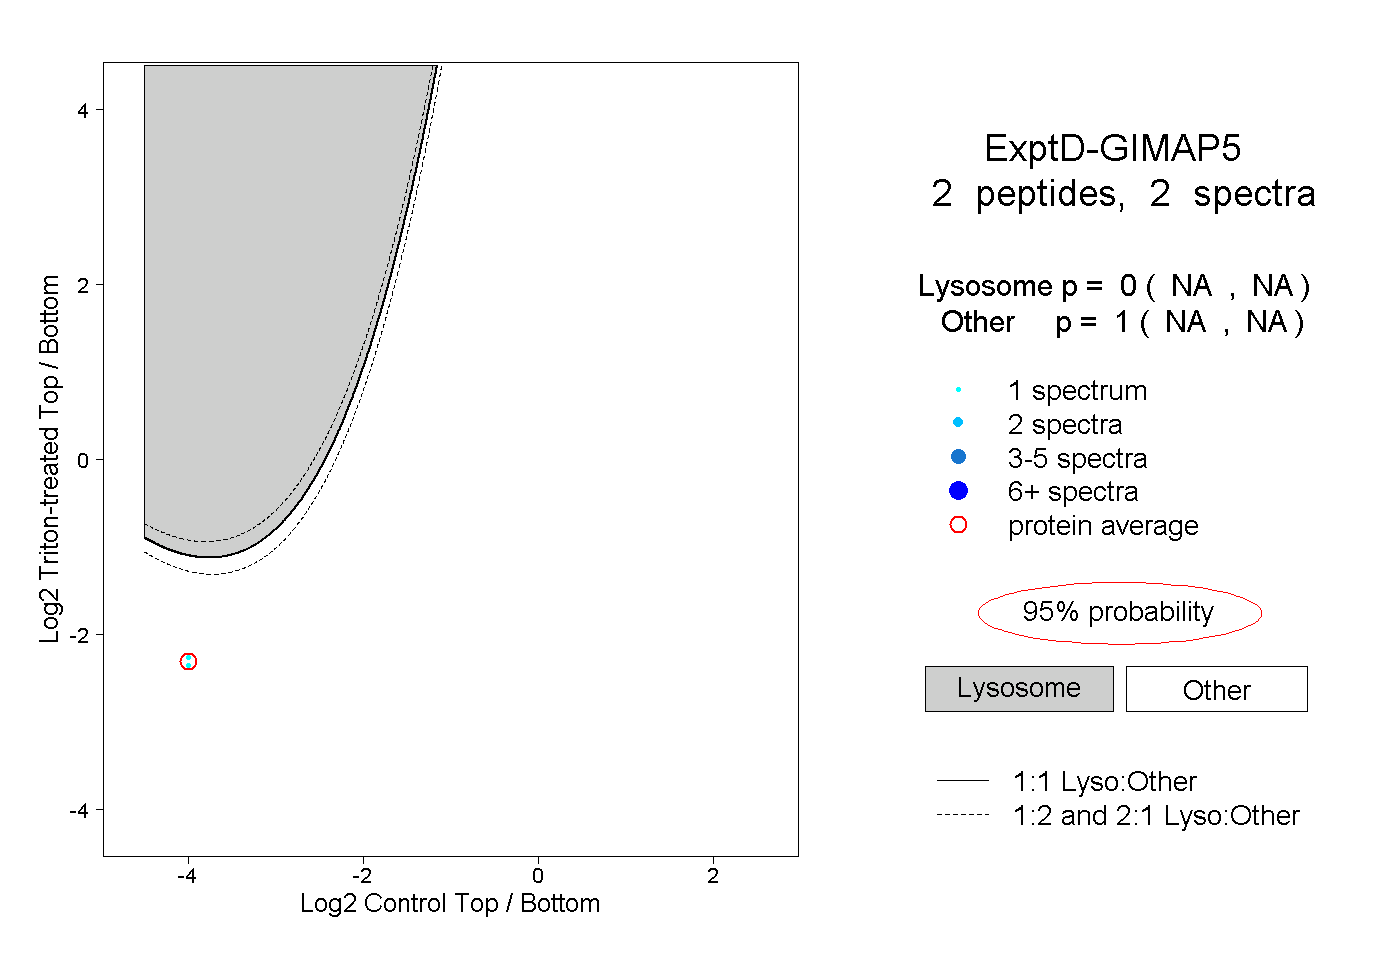 |
0.000 NA | NA |
1.000 NA | NA |