 7
7peptides
spectra
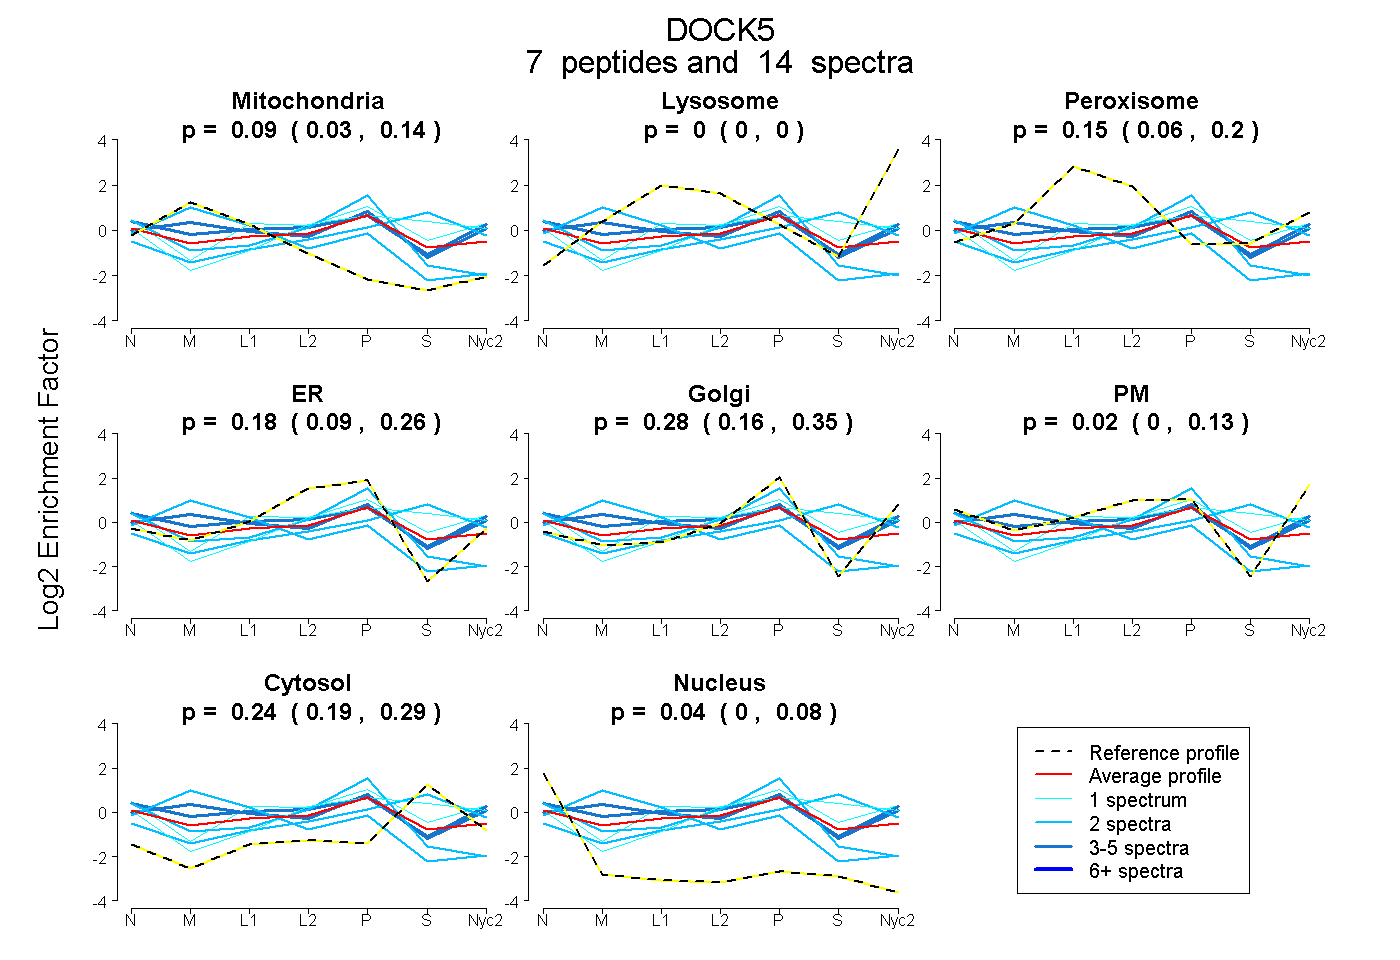
0.028 | 0.144
0.000 | 0.000
0.062 | 0.200
0.095 | 0.263
0.156 | 0.347
0.000 | 0.125
0.192 | 0.291
0.000 | 0.078
8peptides
spectra
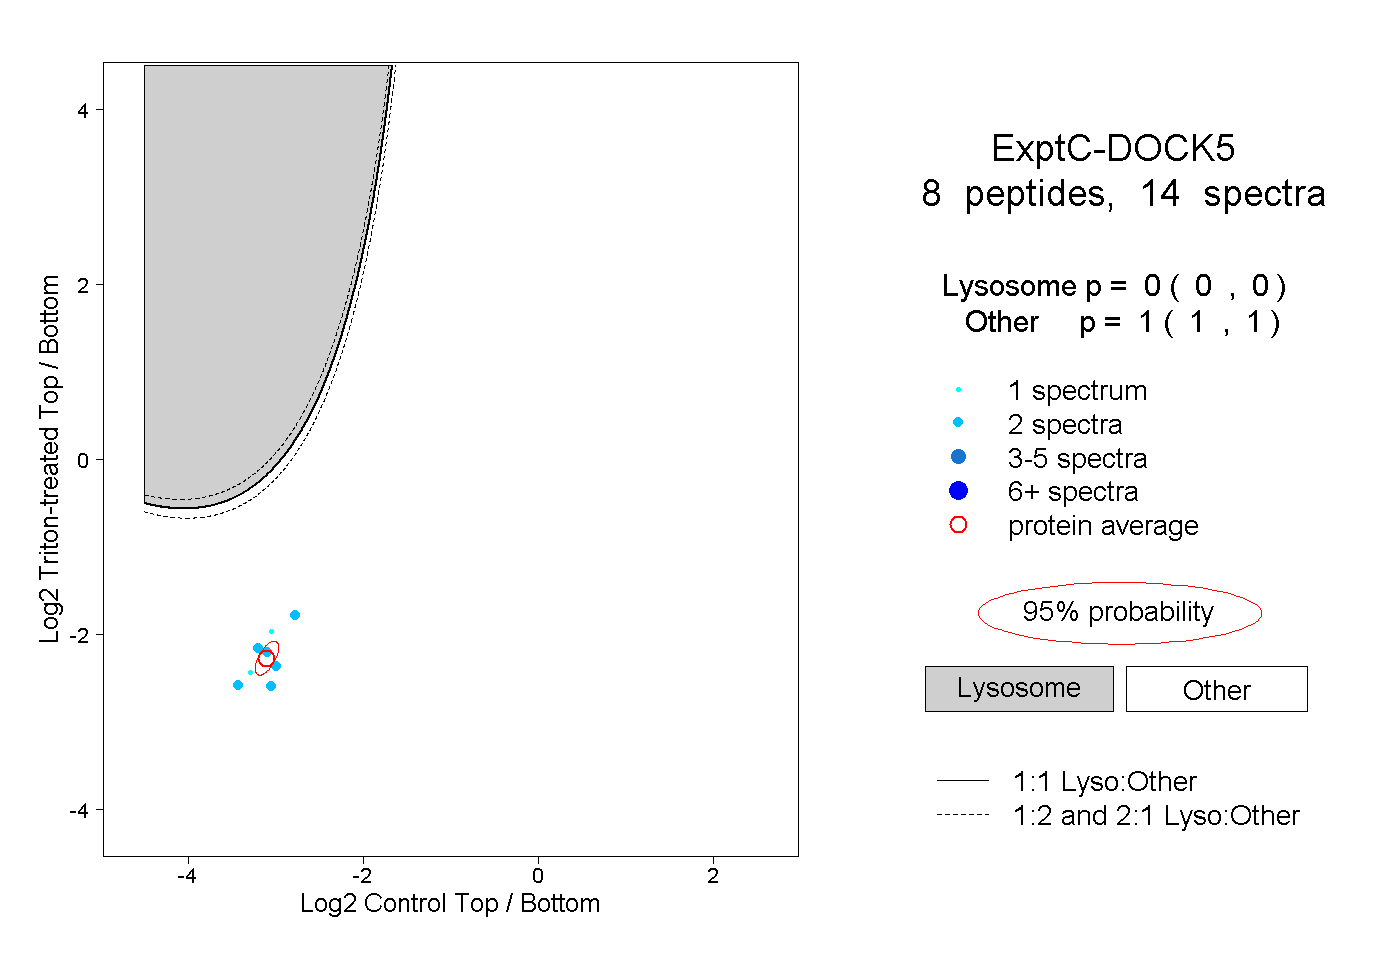
0.000 | 0.000
1.000 | 1.000
1peptide
spectrum
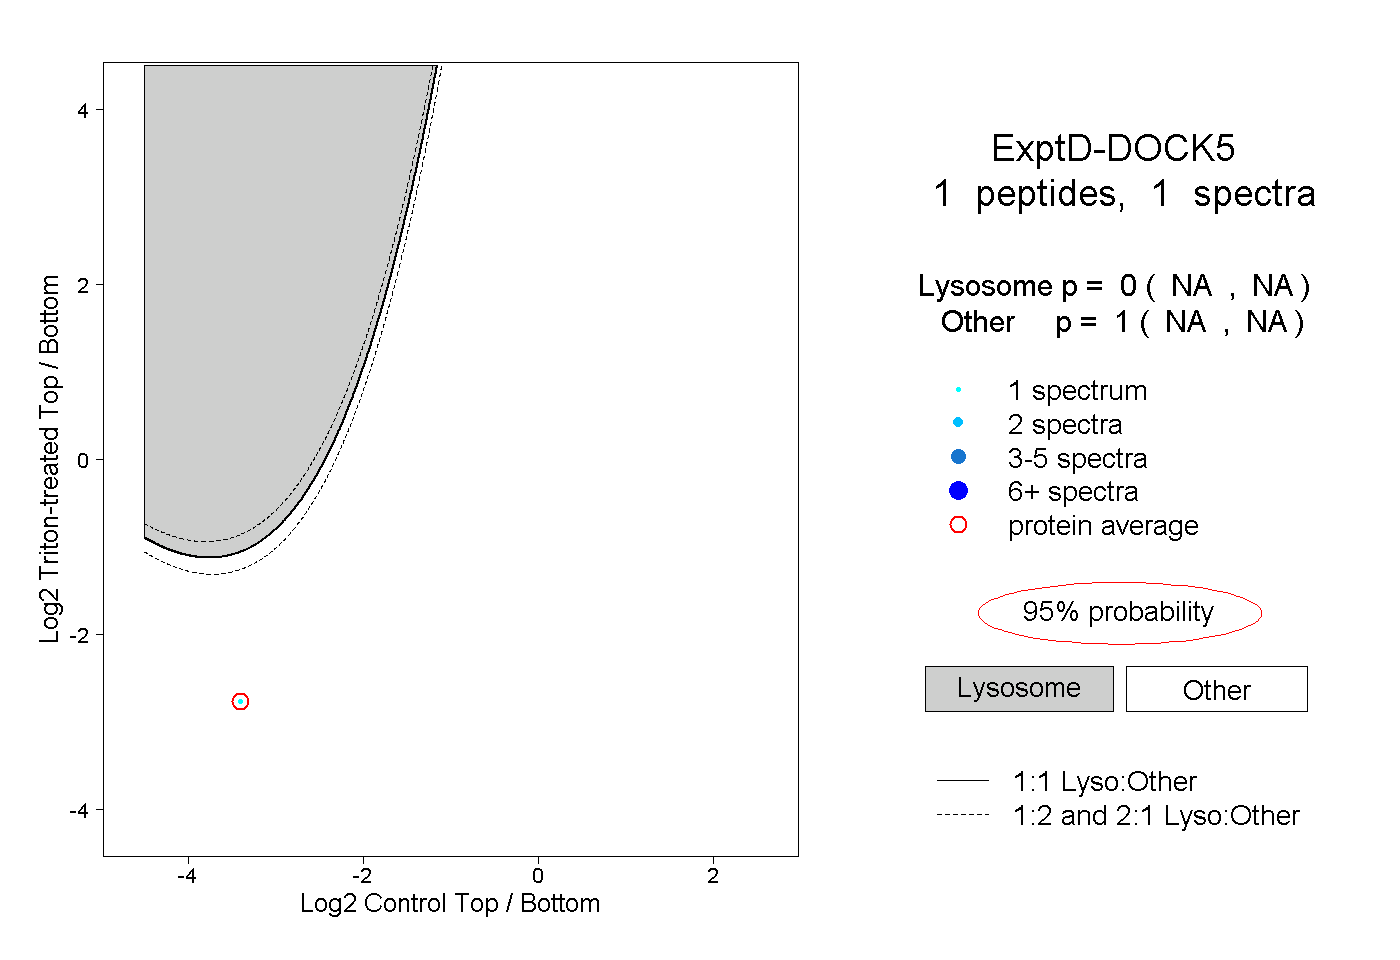
NA | NA
NA | NA