 7
7peptides
spectra
0.028 | 0.144
0.000 | 0.000
0.062 | 0.200
0.095 | 0.263
0.156 | 0.347
0.000 | 0.125
0.192 | 0.291
0.000 | 0.078
8peptides
spectra
0.000 | 0.000
1.000 | 1.000
| Plot | Mito | Lyso | Perox | ER | Golgi | PM | Cytosol | Nucleus | |||||
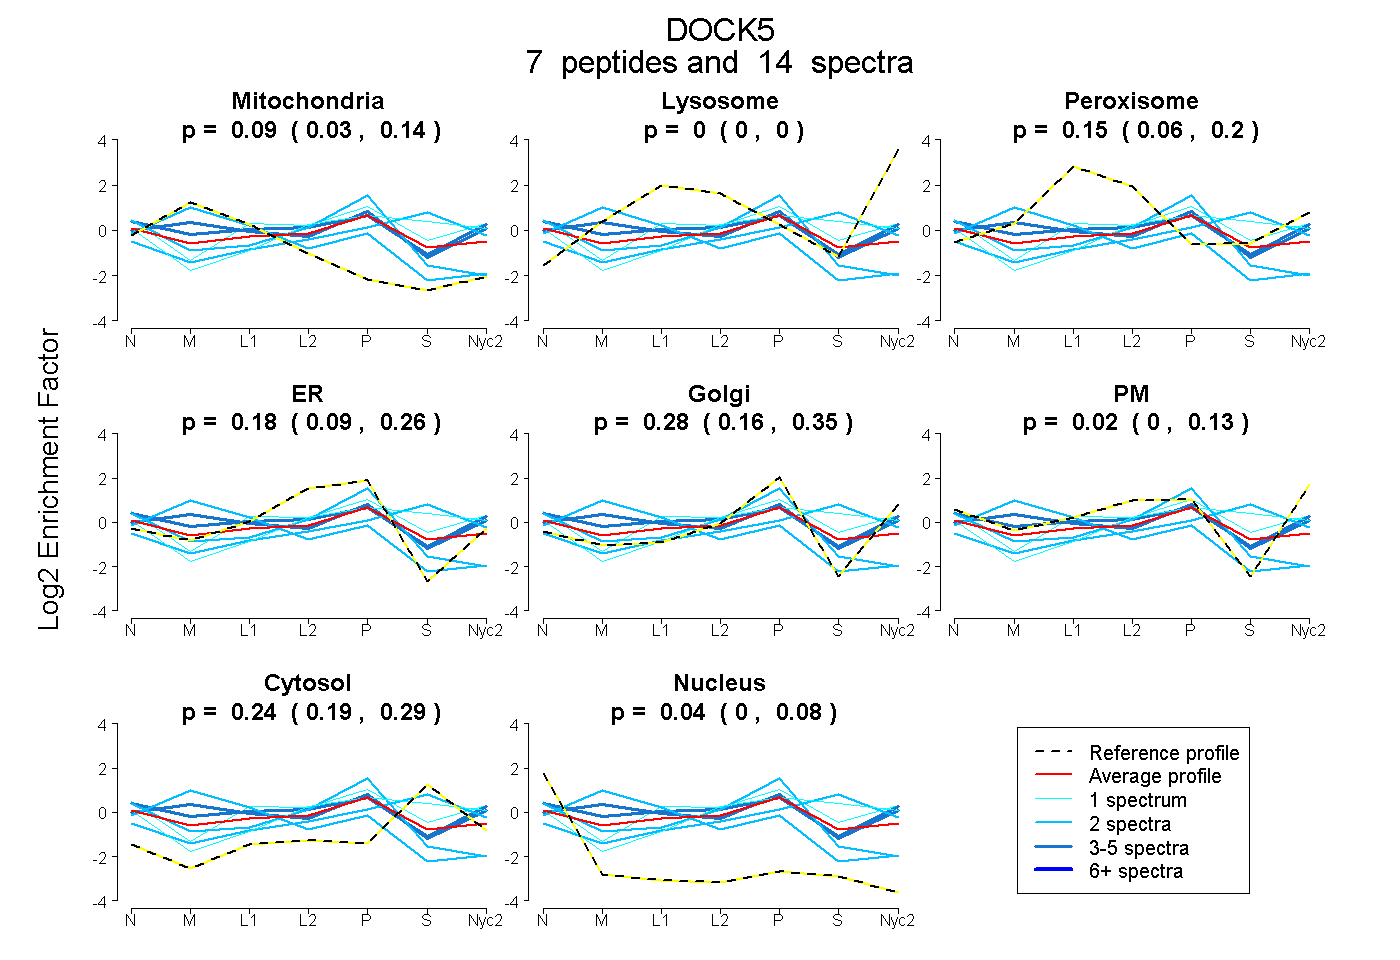
| Expt A |
7 peptides |
14 spectra |
|
0.090 0.028 | 0.144 |
0.000 0.000 | 0.000 |
0.152 0.062 | 0.200 |
0.180 0.095 | 0.263 |
0.279 0.156 | 0.347 |
0.019 0.000 | 0.125 |
0.239 0.192 | 0.291 |
0.041 0.000 | 0.078 |
||
| Plot | Lyso | Other | |||||||||||
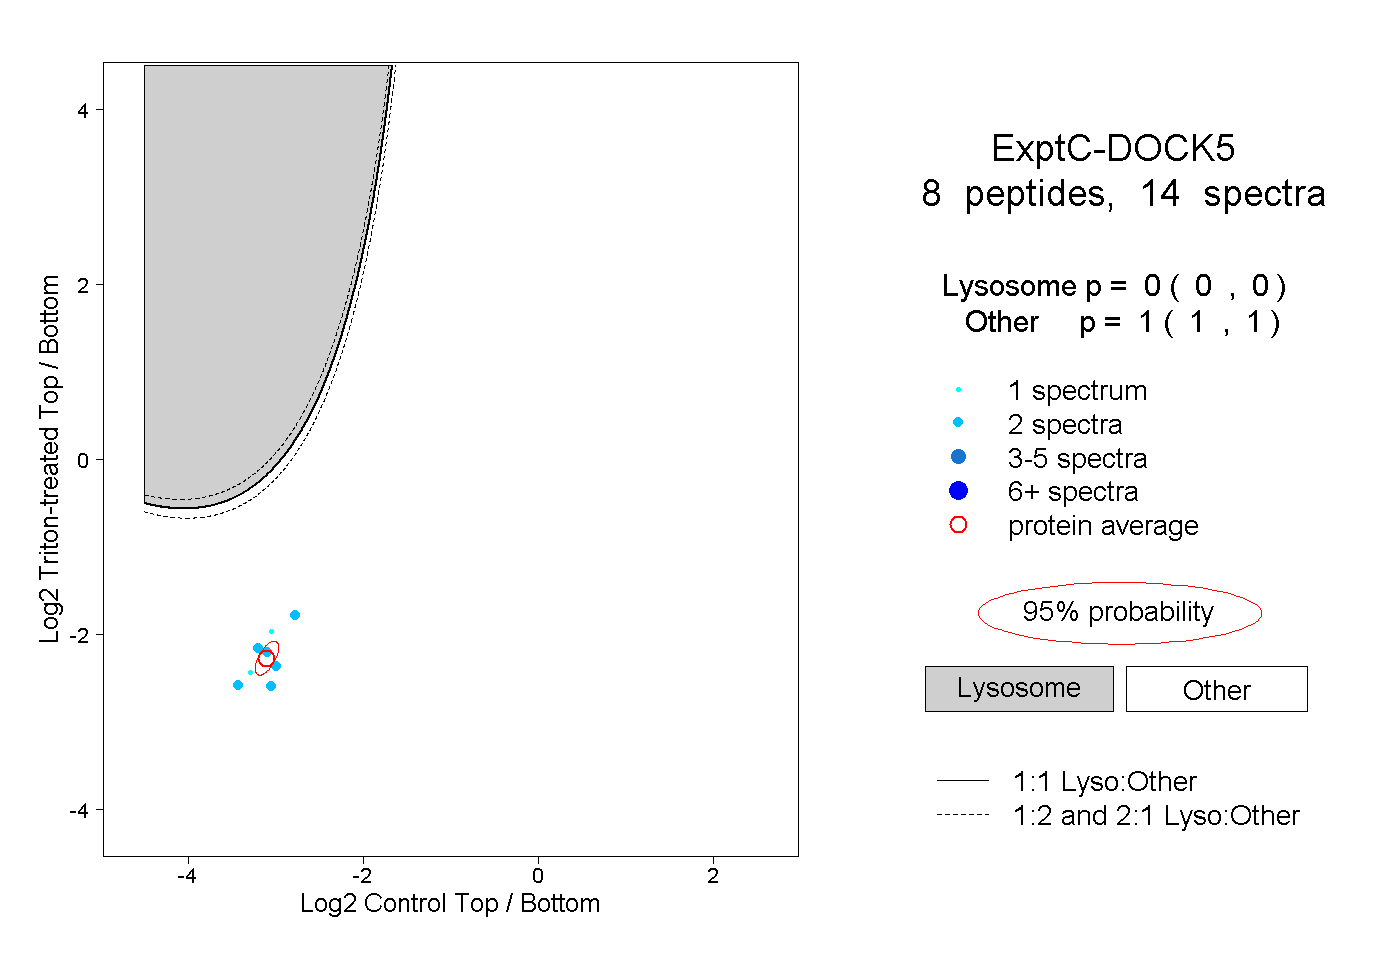
| Expt C |
8 peptides |
14 spectra |
|
0.000 0.000 | 0.000 |
1.000 1.000 | 1.000 |
| 2 spectra, STAIAR | 0.000 | 1.000 | ||||||||
| 2 spectra, DELAELK | 0.000 | 1.000 | ||||||||
| 2 spectra, MTSTTPPGEDIR | 0.000 | 1.000 | ||||||||
| 2 spectra, ISLVCQIVR | 0.000 | 1.000 | ||||||||
| 2 spectra, YYLTLPGTK | 0.000 | 1.000 | ||||||||
| 1 spectrum, AFFTEK | 0.000 | 1.000 | ||||||||
| 1 spectrum, LYVNNK | 0.000 | 1.000 | ||||||||
| 2 spectra, GYALQNR | 0.000 | 1.000 |
| Plot | Lyso | Other | |||||||||||
| Expt D |
1 peptide |
1 spectrum |
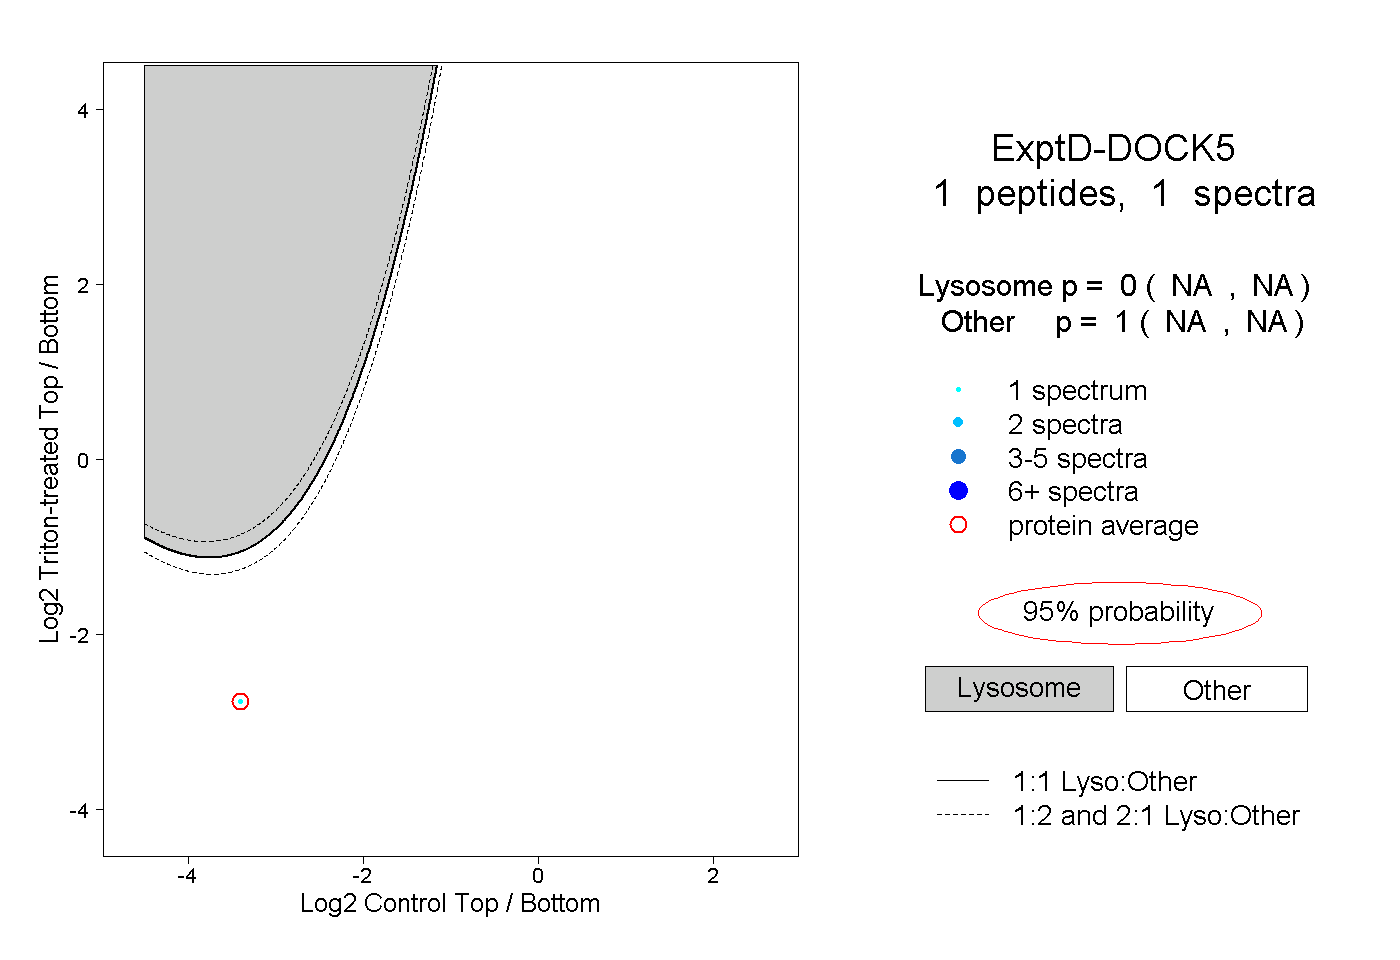 |
0.000 NA | NA |
1.000 NA | NA |