 4
4peptides
spectra
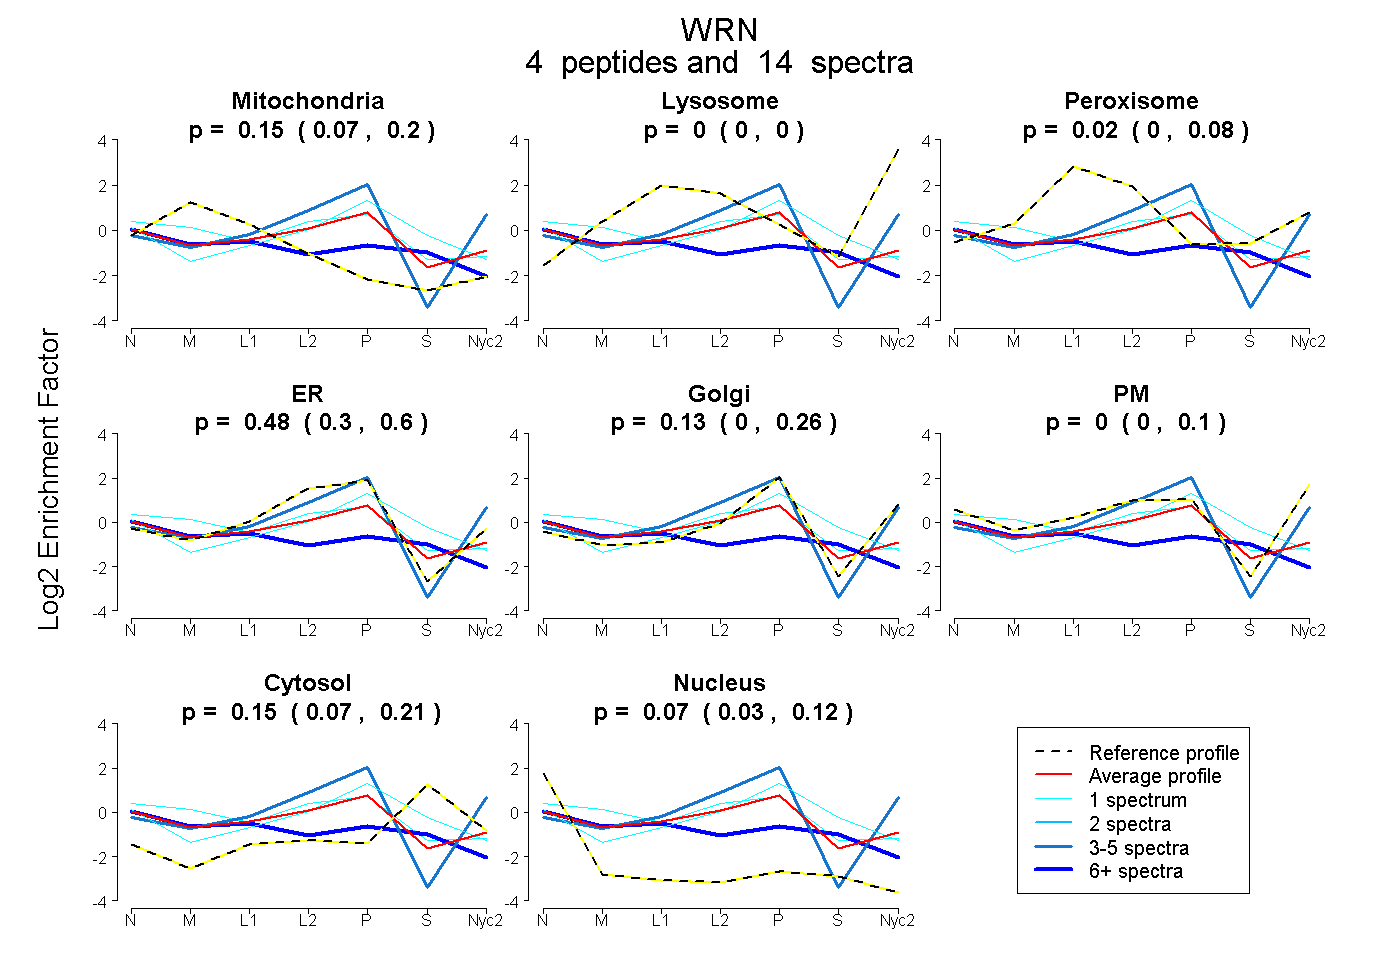
0.070 | 0.201
0.000 | 0.000
0.000 | 0.082
0.300 | 0.595
0.000 | 0.263
0.000 | 0.096
0.067 | 0.213
0.025 | 0.117
1peptide
spectra
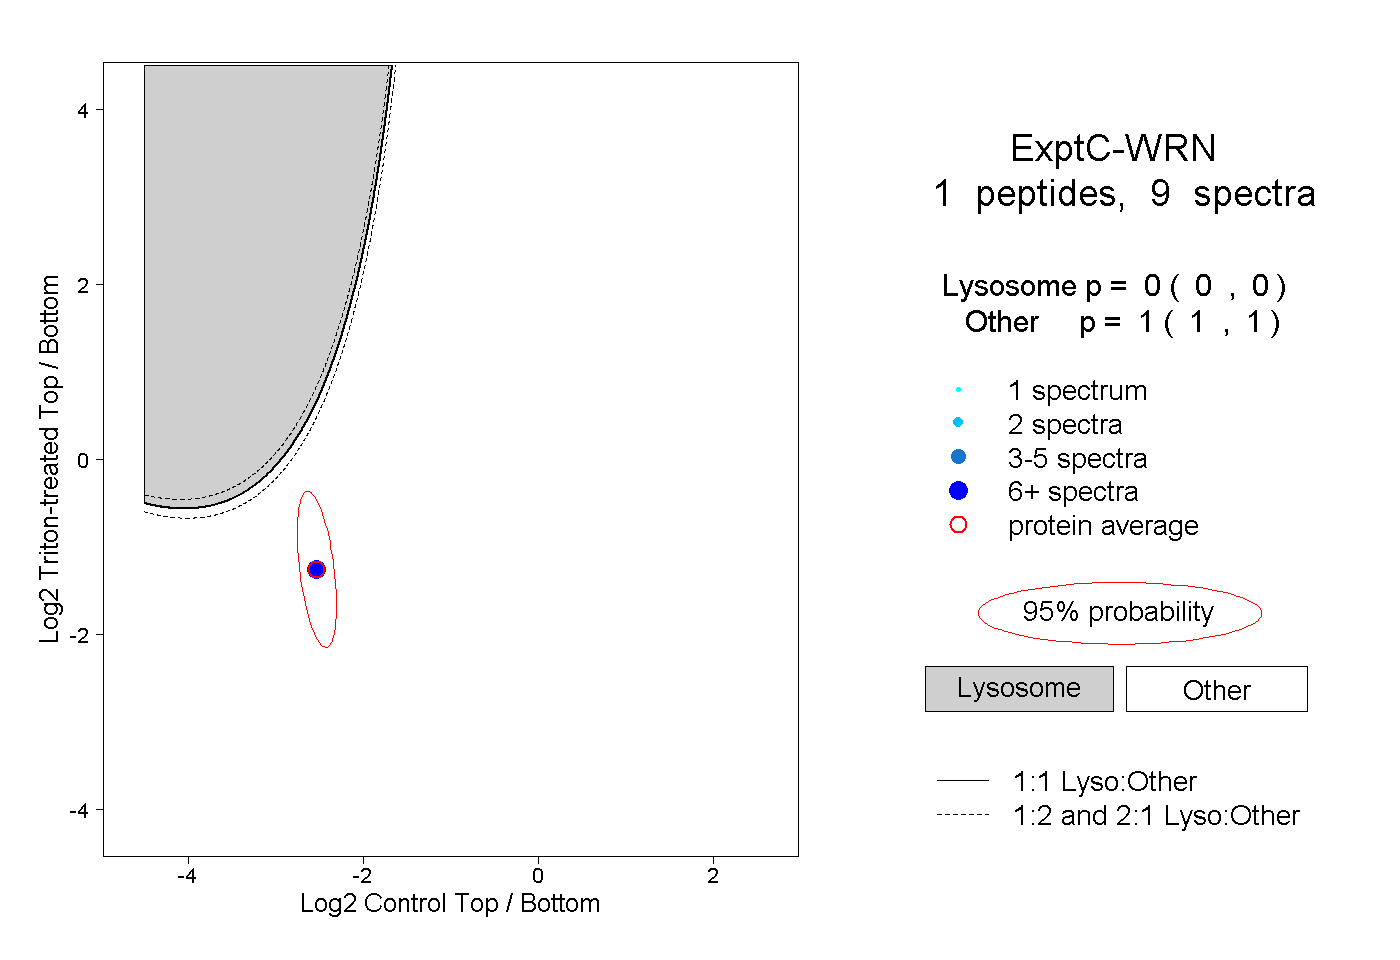
0.000 | 0.000
1.000 | 1.000
2peptides
spectra
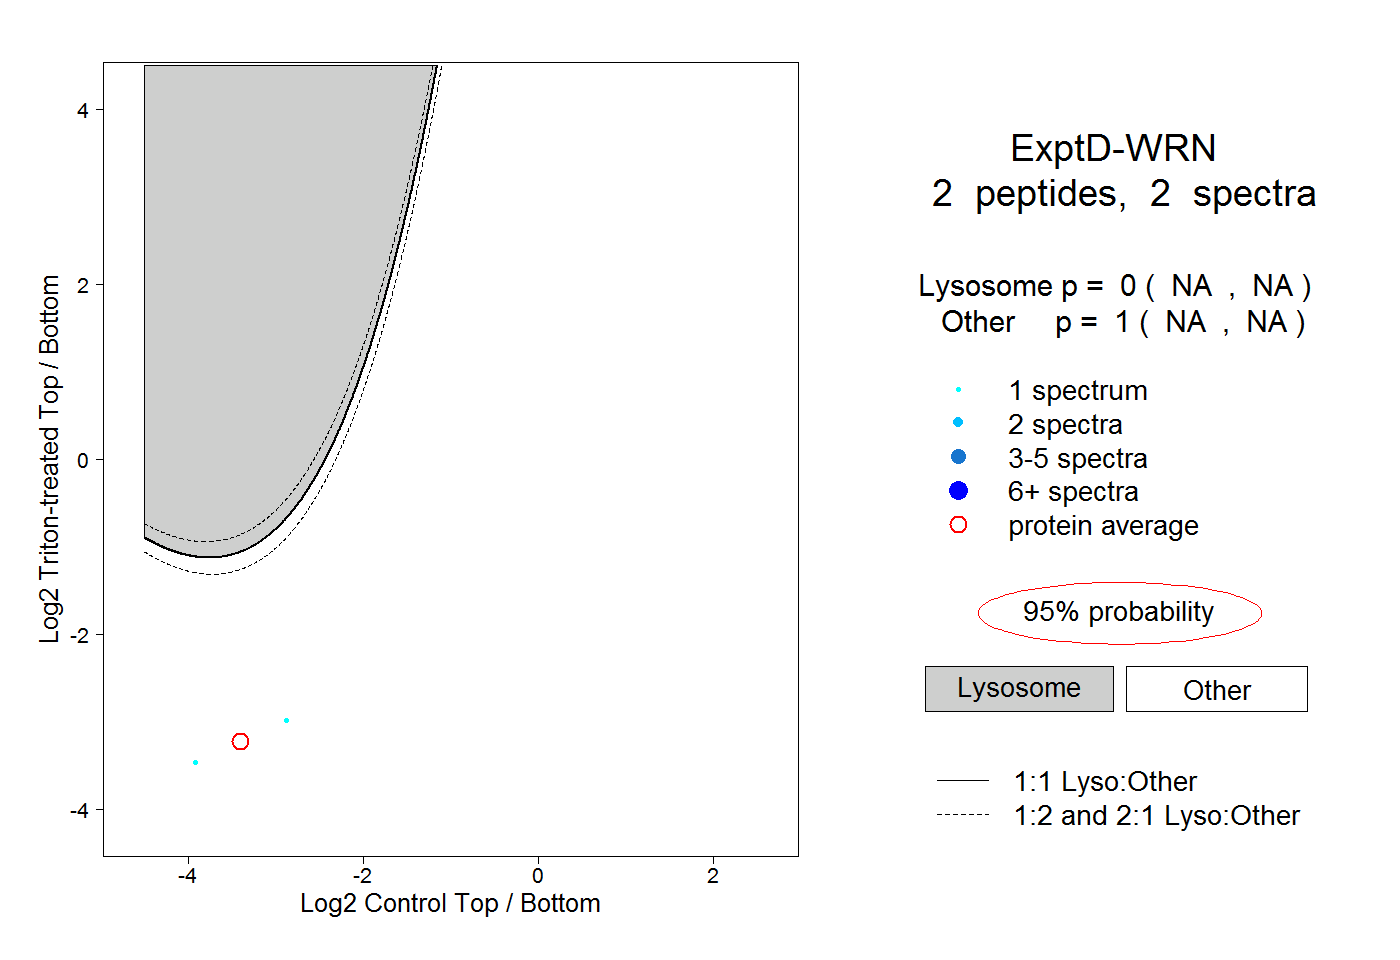
NA | NA
NA | NA