 4
4peptides
spectra
0.070 | 0.201
0.000 | 0.000
0.000 | 0.082
0.300 | 0.595
0.000 | 0.263
0.000 | 0.096
0.067 | 0.213
0.025 | 0.117
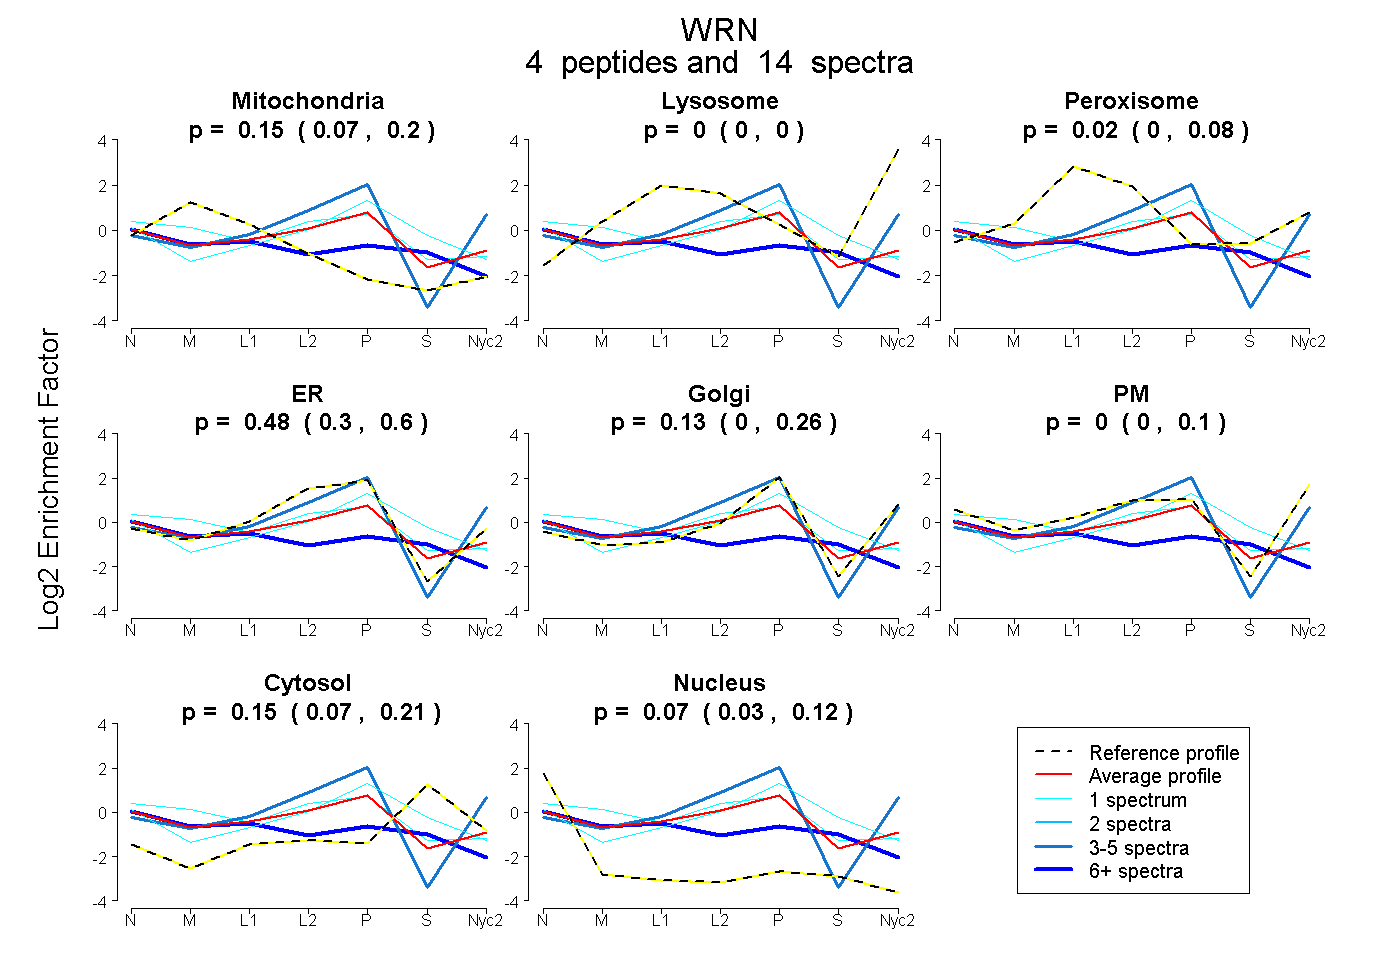
| Plot | Mito | Lyso | Perox | ER | Golgi | PM | Cytosol | Nucleus | |||||
| Expt A |
4 peptides |
14 spectra |
|
0.145 0.070 | 0.201 |
0.000 0.000 | 0.000 |
0.017 0.000 | 0.082 |
0.485 0.300 | 0.595 |
0.130 0.000 | 0.263 |
0.000 0.000 | 0.096 |
0.153 0.067 | 0.213 |
0.071 0.025 | 0.117 |
| 1 spectrum, CLNLK | 0.267 | 0.000 | 0.000 | 0.544 | 0.000 | 0.023 | 0.156 | 0.010 | ||
| 5 spectra, LFGAGK | 0.000 | 0.000 | 0.000 | 0.460 | 0.344 | 0.196 | 0.000 | 0.000 | ||
| 1 spectrum, VIHSVLEER | 0.000 | 0.000 | 0.000 | 0.560 | 0.000 | 0.000 | 0.402 | 0.037 | ||
| 7 spectra, IPILFLR | 0.355 | 0.000 | 0.000 | 0.210 | 0.000 | 0.000 | 0.307 | 0.128 |
| Plot | Lyso | Other | |||||||||||
| Expt C |
1 peptide |
9 spectra |
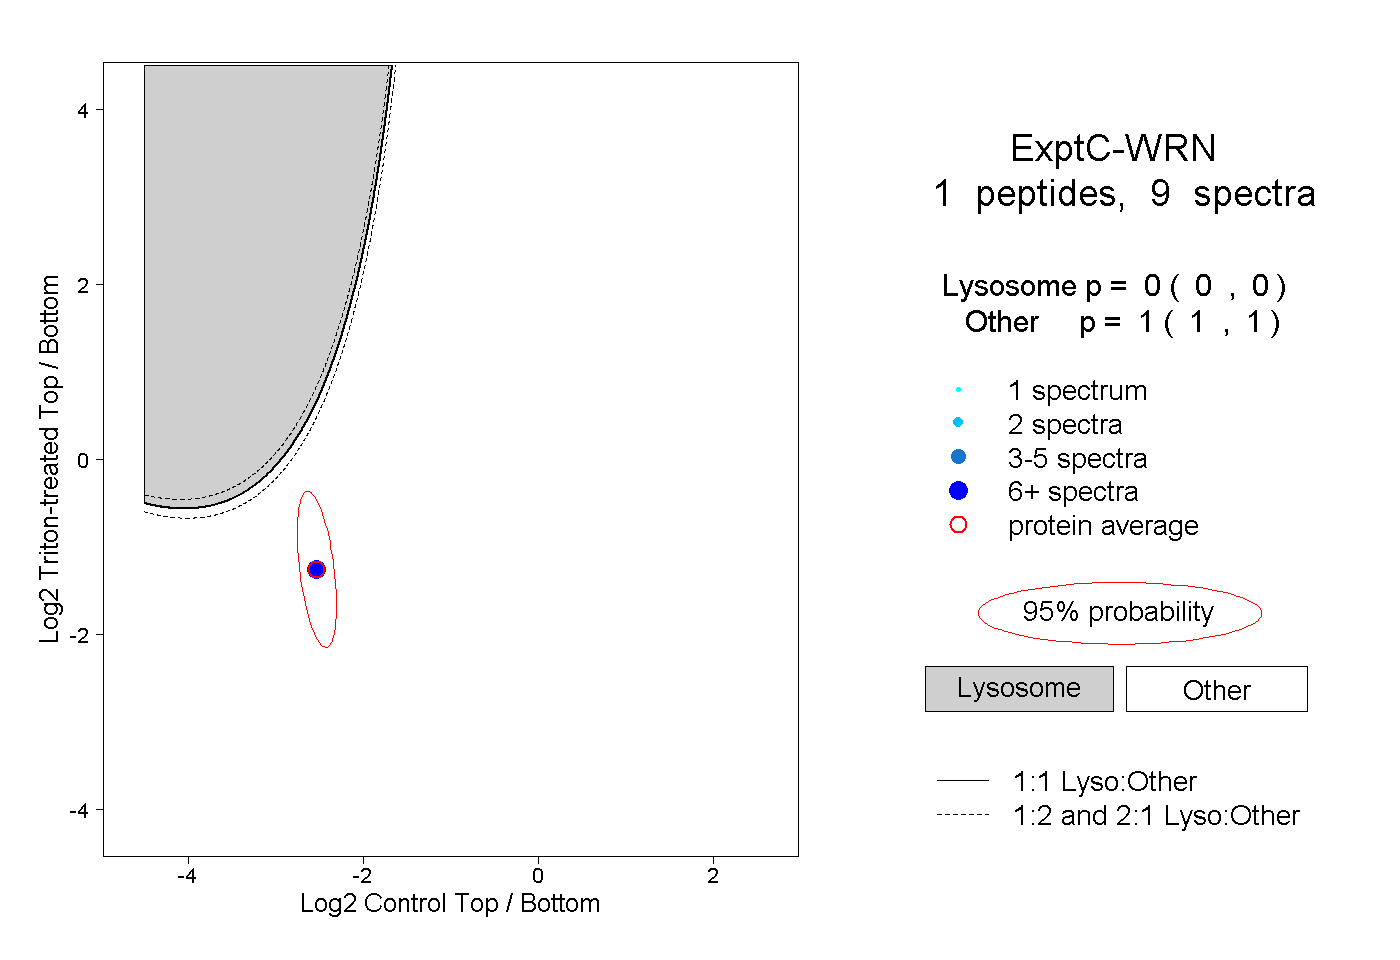 |
0.000 0.000 | 0.000 |
1.000 1.000 | 1.000 |
||||||||
| Plot | Lyso | Other | |||||||||||
| Expt D |
2 peptides |
2 spectra |
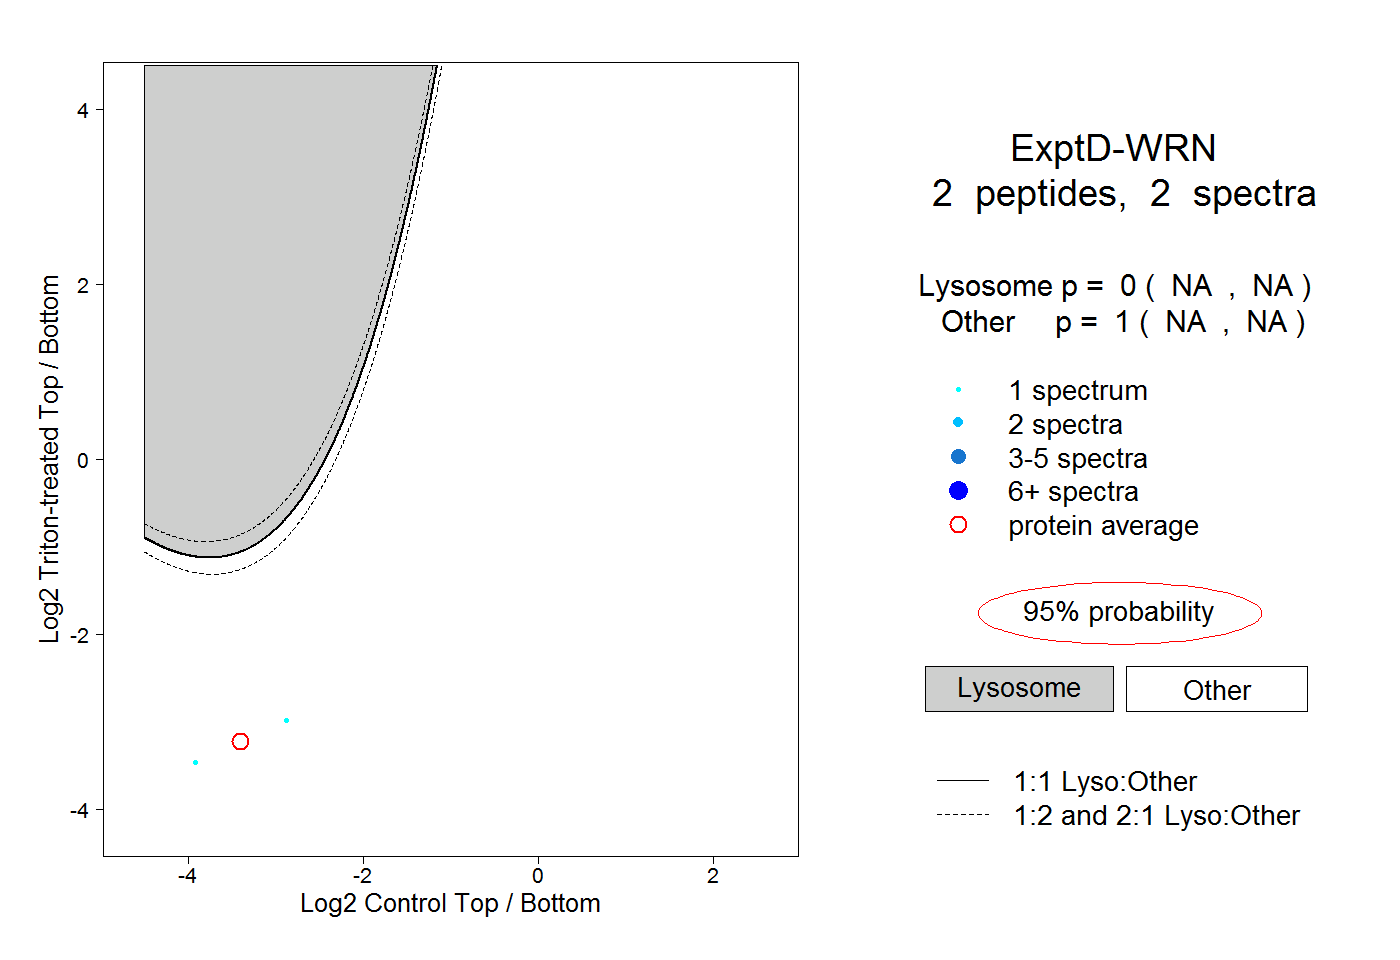 |
0.000 NA | NA |
1.000 NA | NA |