 10
10peptides
spectra
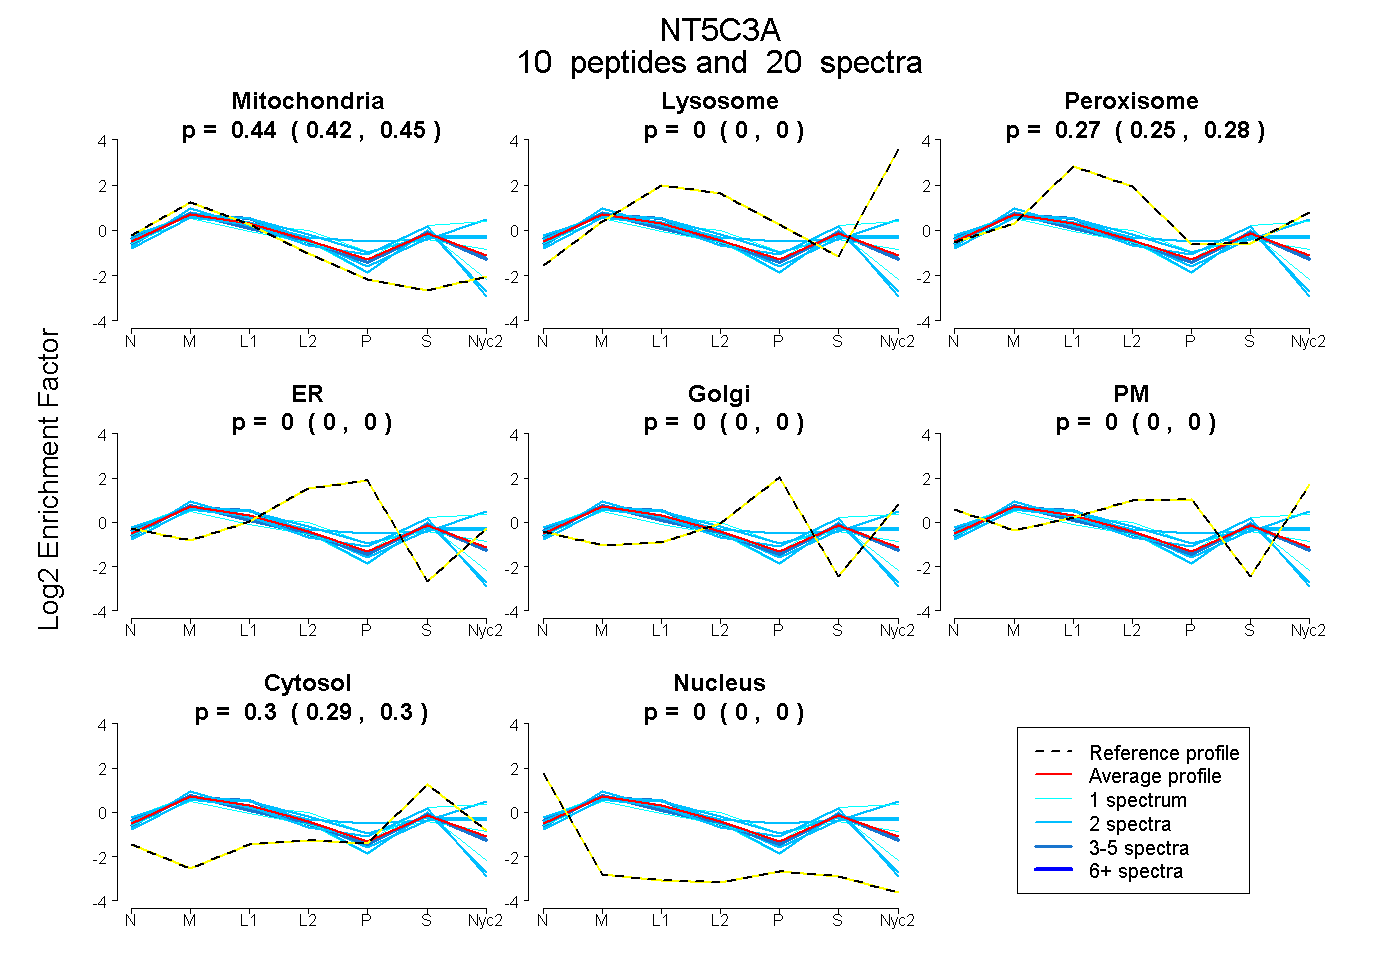
0.421 | 0.451
0.000 | 0.000
0.250 | 0.278
0.000 | 0.000
0.000 | 0.000
0.000 | 0.000
0.291 | 0.300
0.000 | 0.000
1peptide
spectrum
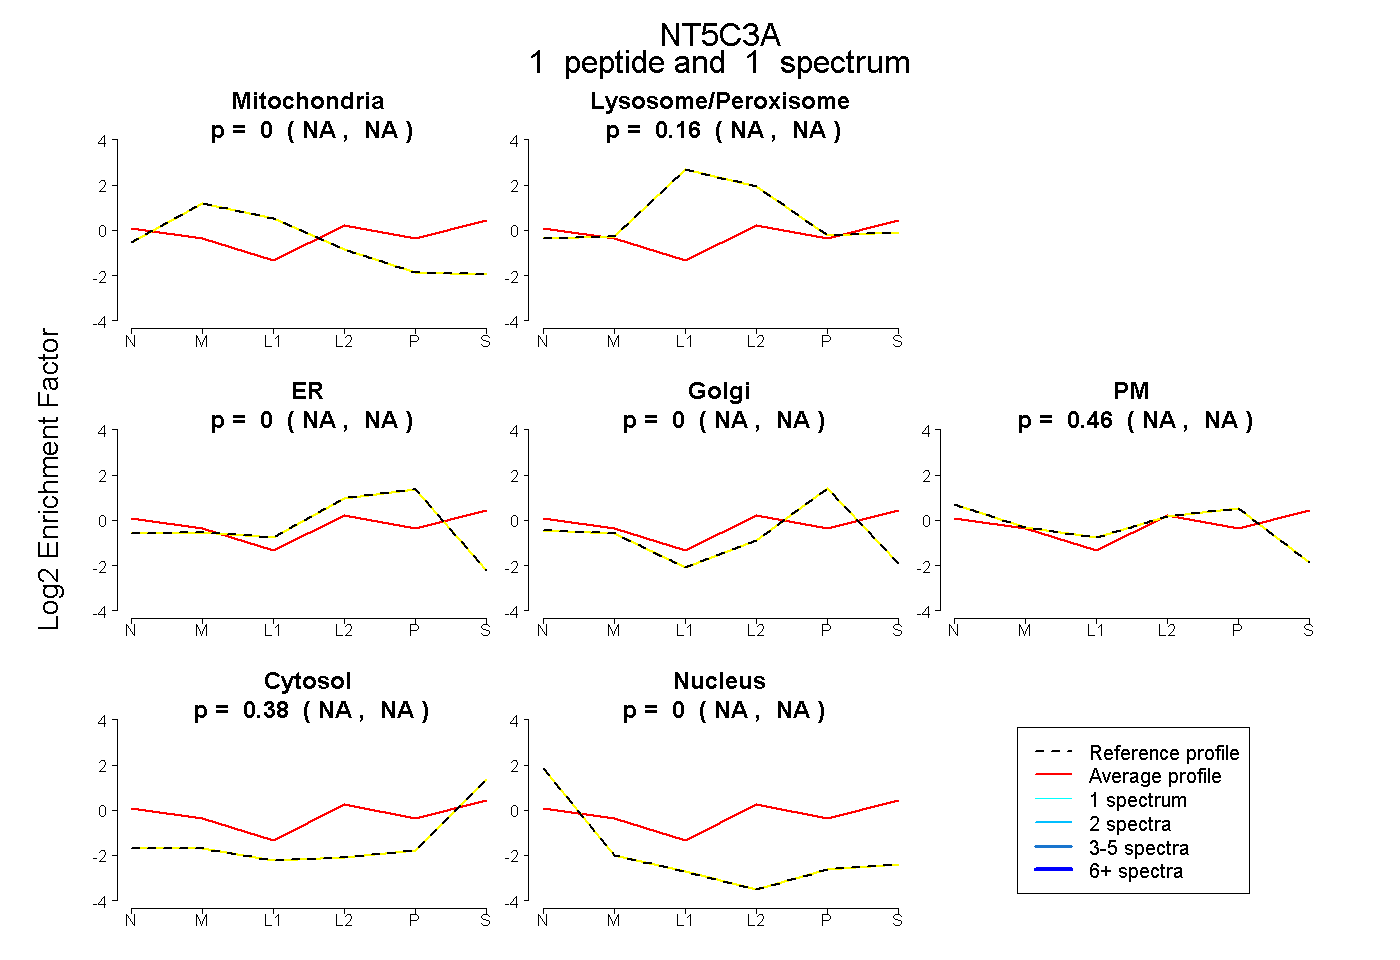
NA | NA
NA | NA
NA | NA
NA | NA
NA | NA
NA | NA
NA | NA
13peptides
spectra
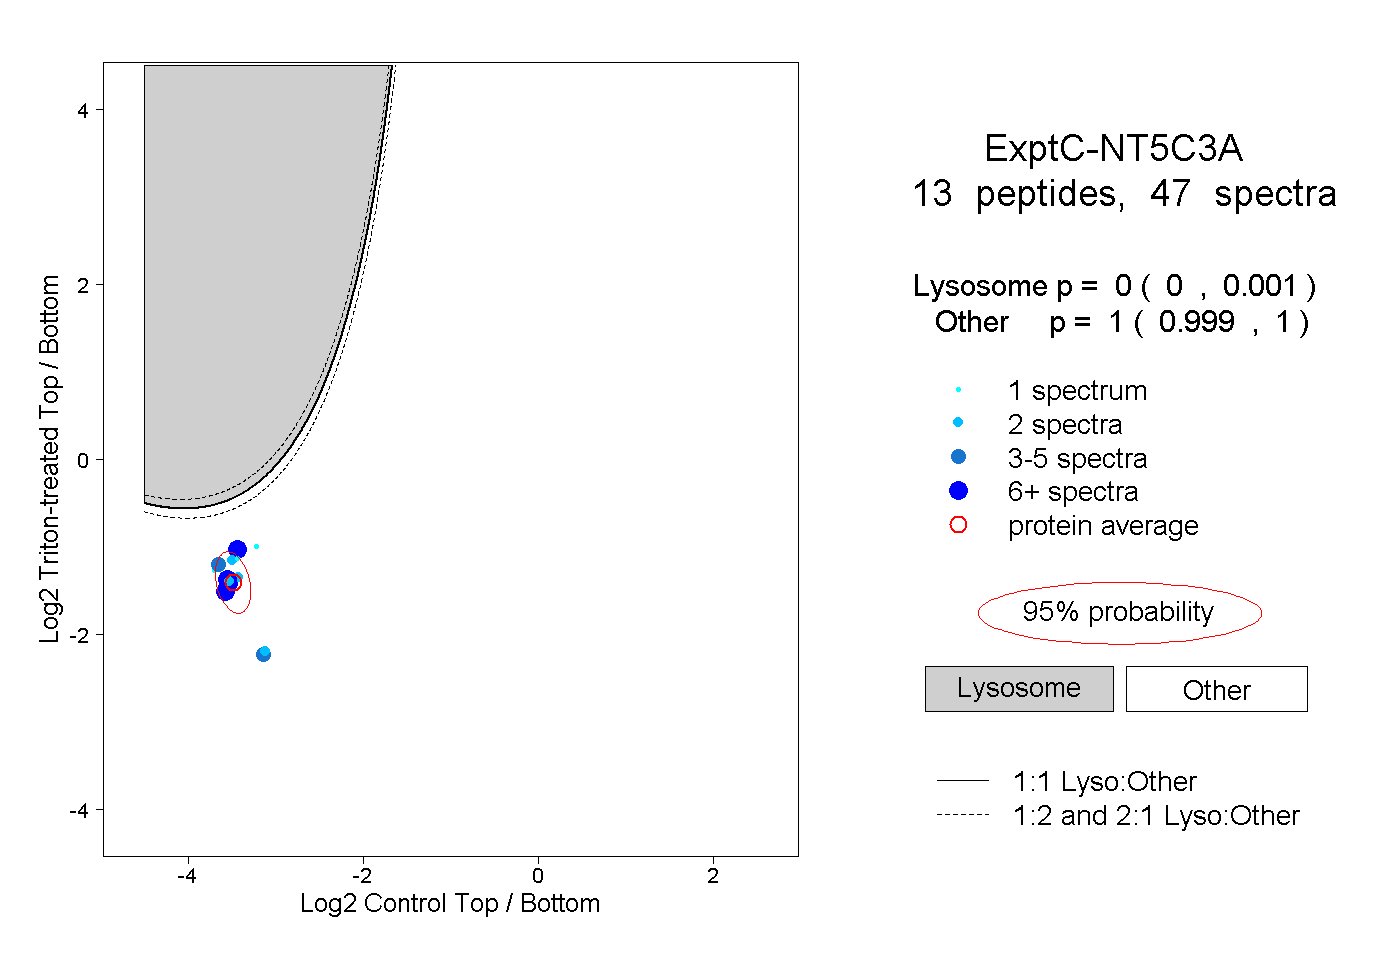
0.000 | 0.001
0.999 | 1.000
2peptides
spectra
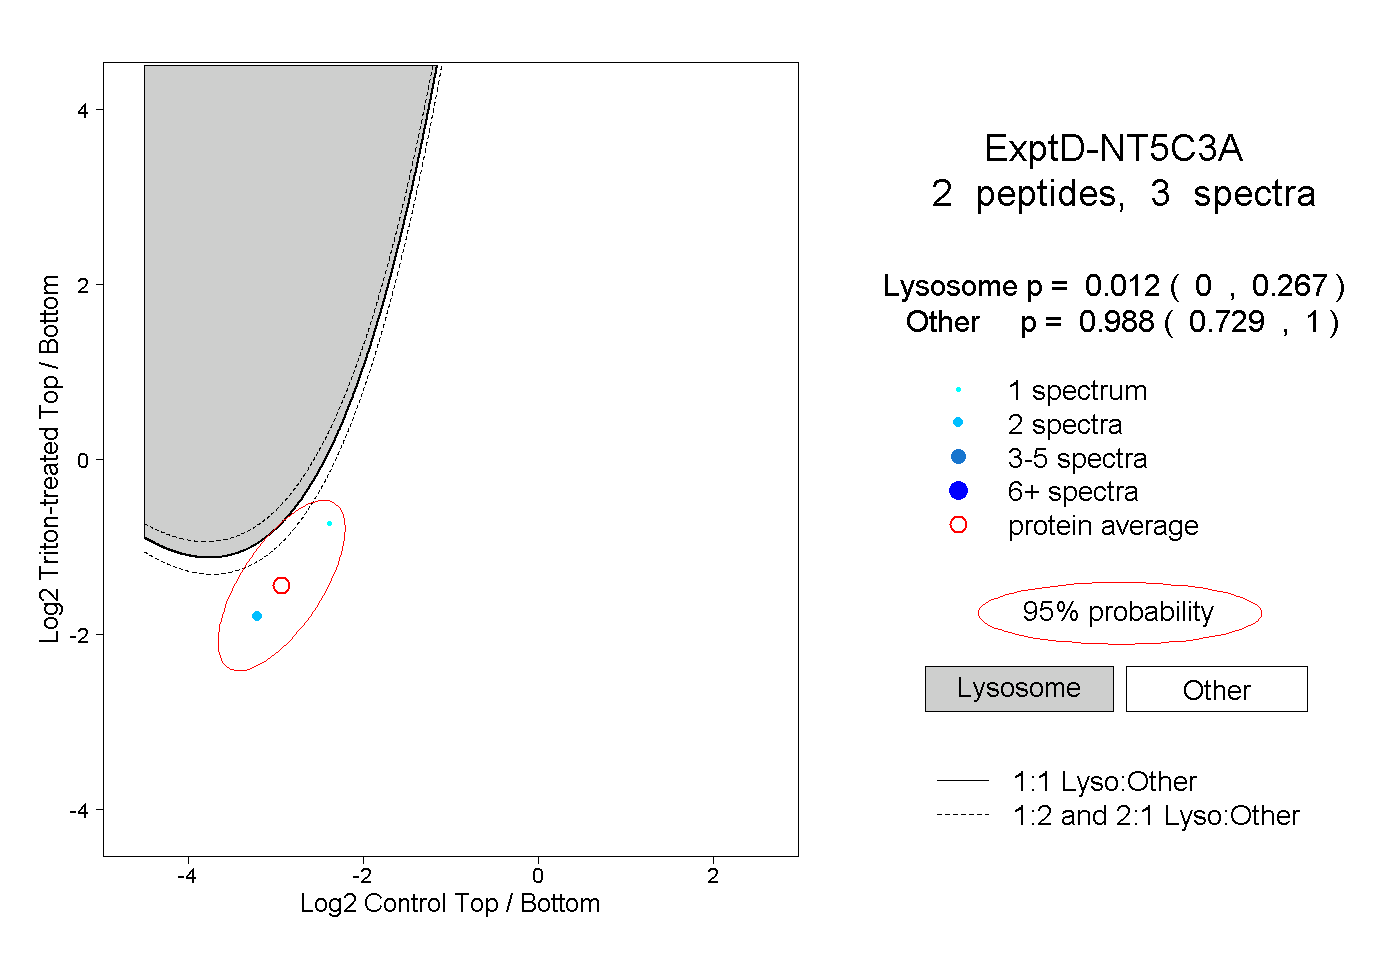
0.000 | 0.267
0.729 | 1.000