 10
10peptides
spectra
0.421 | 0.451
0.000 | 0.000
0.250 | 0.278
0.000 | 0.000
0.000 | 0.000
0.000 | 0.000
0.291 | 0.300
0.000 | 0.000
| Plot | Mito | Lyso | Perox | ER | Golgi | PM | Cytosol | Nucleus | |||||
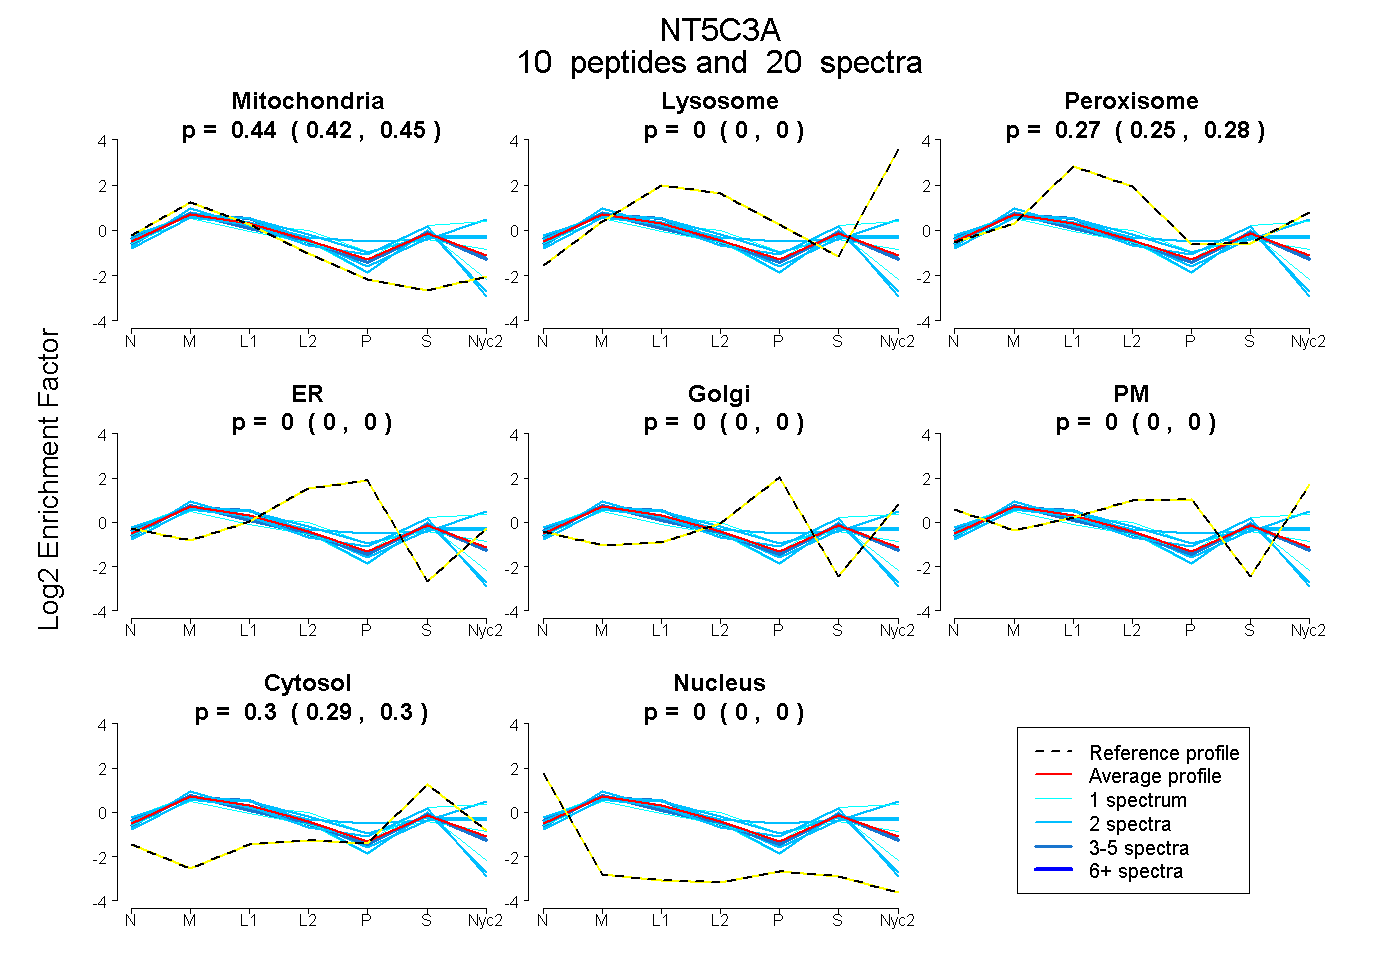
| Expt A |
10 peptides |
20 spectra |
|
0.438 0.421 | 0.451 |
0.000 0.000 | 0.000 |
0.266 0.250 | 0.278 |
0.000 0.000 | 0.000 |
0.000 0.000 | 0.000 |
0.000 0.000 | 0.000 |
0.296 0.291 | 0.300 |
0.000 0.000 | 0.000 |
| 4 spectra, VDELLEK | 0.464 | 0.000 | 0.217 | 0.000 | 0.000 | 0.000 | 0.319 | 0.000 | ||
| 2 spectra, YMDSYDIVLVK | 0.552 | 0.000 | 0.091 | 0.000 | 0.000 | 0.000 | 0.357 | 0.000 | ||
| 1 spectrum, VVSNFMDFDENGVLK | 0.310 | 0.289 | 0.023 | 0.000 | 0.000 | 0.000 | 0.378 | 0.000 | ||
| 1 spectrum, DNSNIILLGDSQGDLR | 0.560 | 0.000 | 0.162 | 0.000 | 0.000 | 0.000 | 0.278 | 0.000 | ||
| 3 spectra, EGYENFFGK | 0.467 | 0.000 | 0.256 | 0.000 | 0.000 | 0.000 | 0.277 | 0.000 | ||
| 2 spectra, MADGVANVEHILK | 0.340 | 0.062 | 0.304 | 0.000 | 0.000 | 0.040 | 0.255 | 0.000 | ||
| 2 spectra, NTDYFSQLK | 0.339 | 0.351 | 0.025 | 0.000 | 0.015 | 0.030 | 0.239 | 0.000 | ||
| 2 spectra, GELIHVFNK | 0.467 | 0.174 | 0.103 | 0.000 | 0.000 | 0.000 | 0.256 | 0.000 | ||
| 2 spectra, LVTDECR | 0.595 | 0.000 | 0.129 | 0.000 | 0.000 | 0.000 | 0.277 | 0.000 | ||
| 1 spectrum, FSYNGK | 0.404 | 0.000 | 0.314 | 0.000 | 0.020 | 0.028 | 0.234 | 0.000 |
| Plot | Mito | Lyso or Perox | ER | Golgi | PM | Cytosol | Nucleus | ||||||
| Expt B |
1 peptide |
1 spectrum |
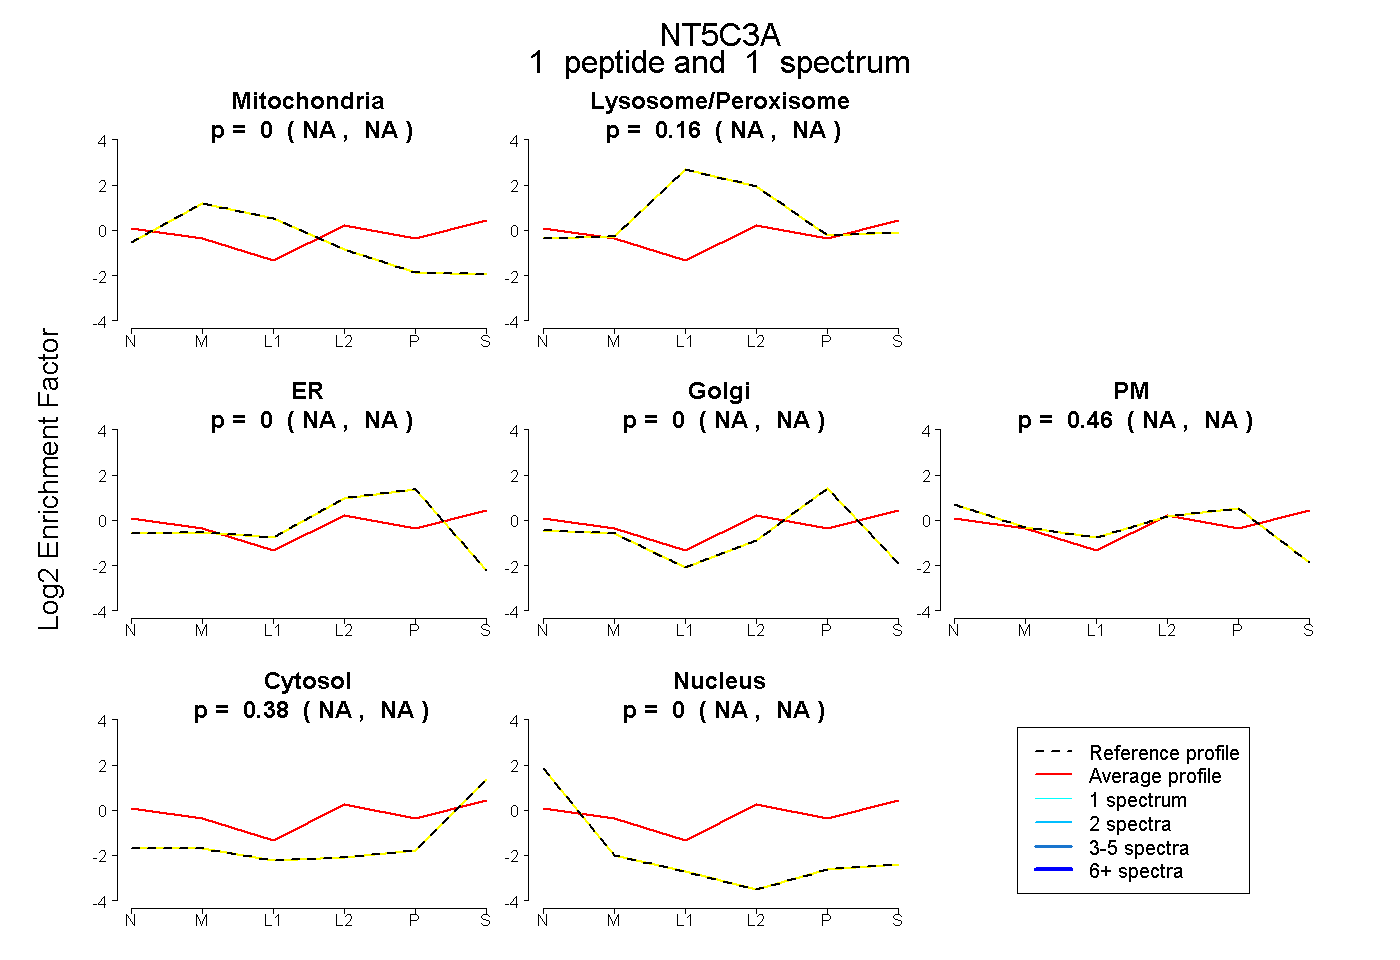 |
0.000 NA | NA |
0.165 NA | NA |
0.000 NA | NA |
0.000 NA | NA |
0.458 NA | NA |
0.377 NA | NA |
0.000 NA | NA |
|||
| Plot | Lyso | Other | |||||||||||
| Expt C |
13 peptides |
47 spectra |
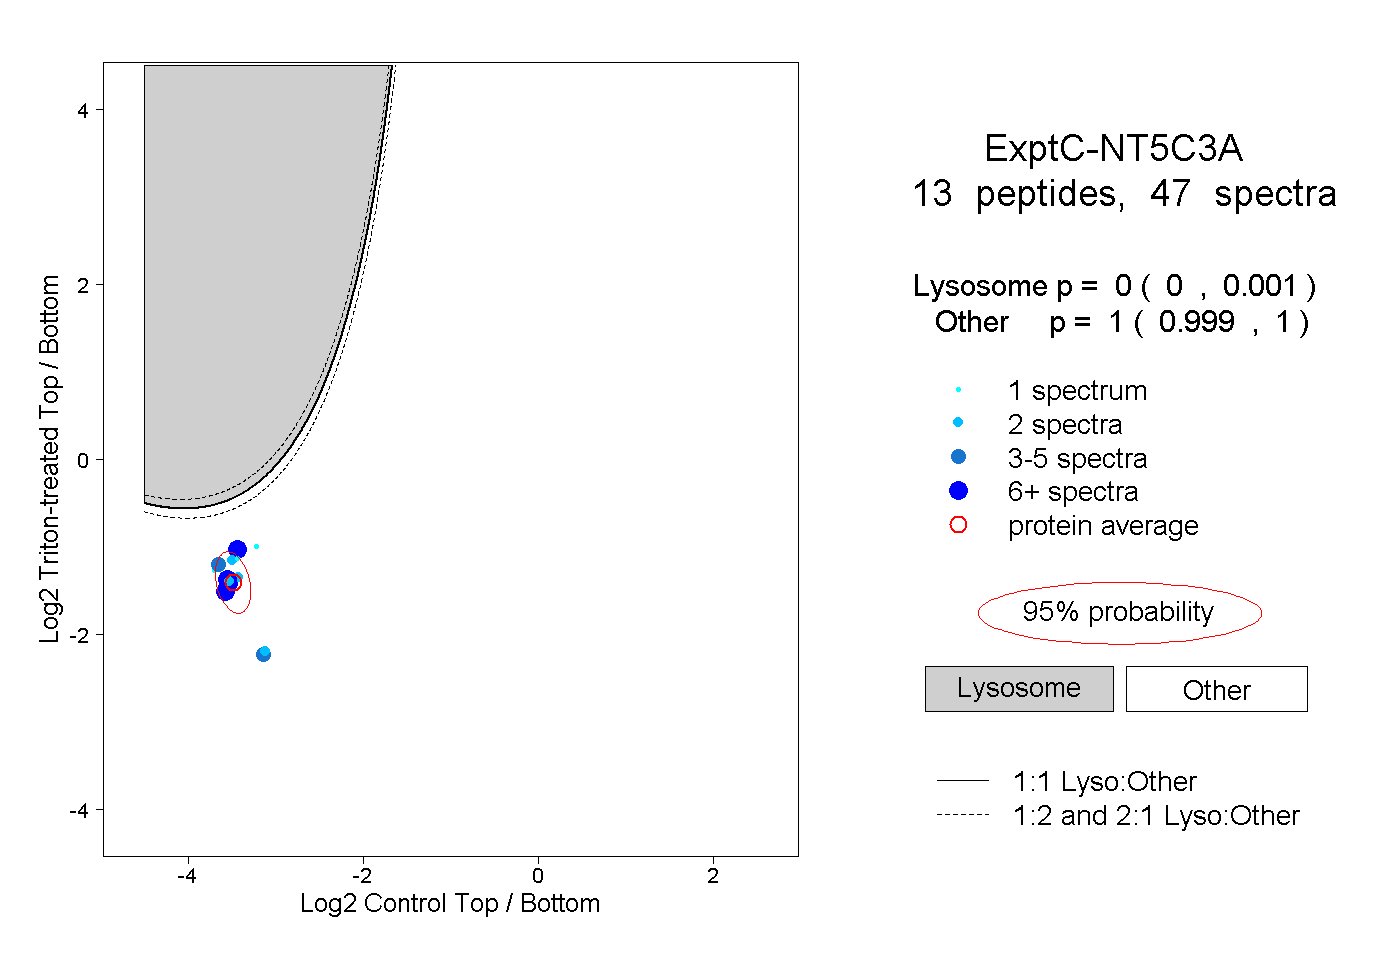 |
0.000 0.000 | 0.001 |
1.000 0.999 | 1.000 |
||||||||
| Plot | Lyso | Other | |||||||||||
| Expt D |
2 peptides |
3 spectra |
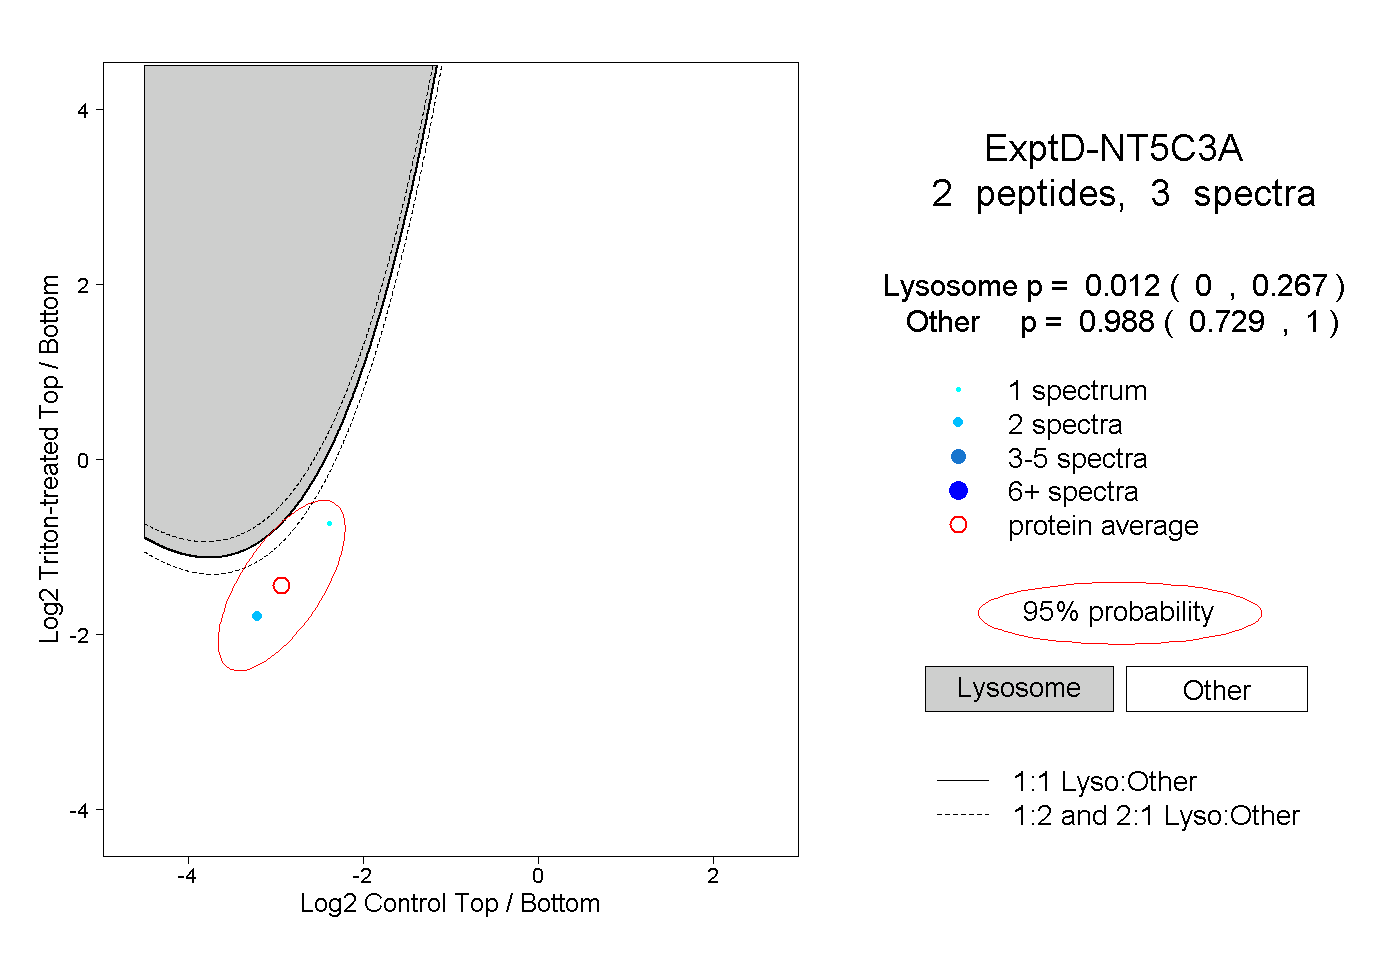 |
0.012 0.000 | 0.267 |
0.988 0.729 | 1.000 |