 14
14peptides
spectra
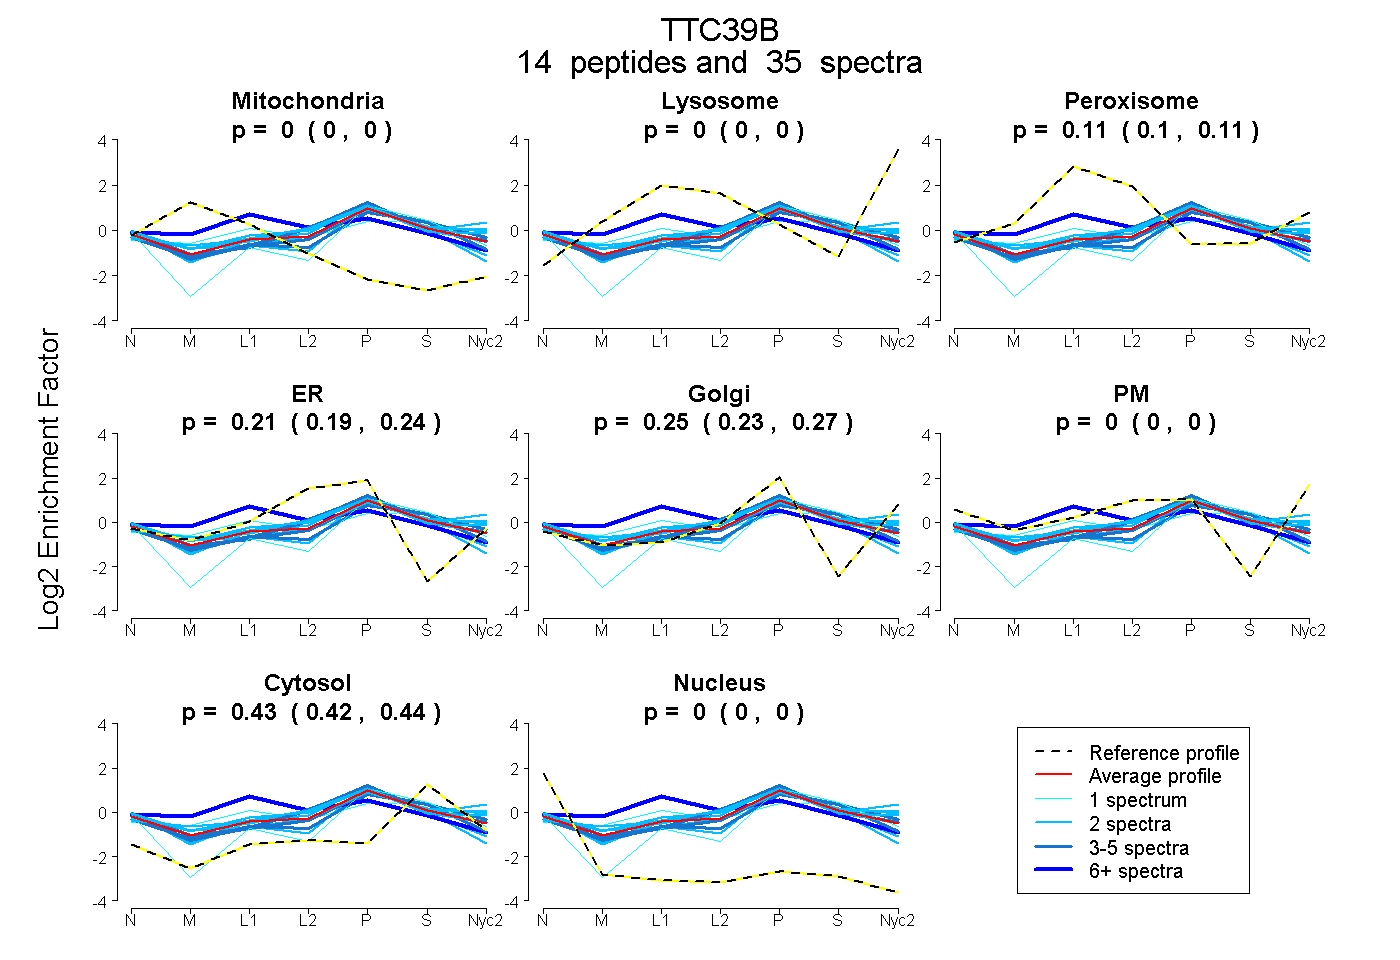
0.000 | 0.000
0.000 | 0.000
0.096 | 0.115
0.189 | 0.235
0.227 | 0.270
0.000 | 0.000
0.422 | 0.435
0.000 | 0.000
4peptides
spectra
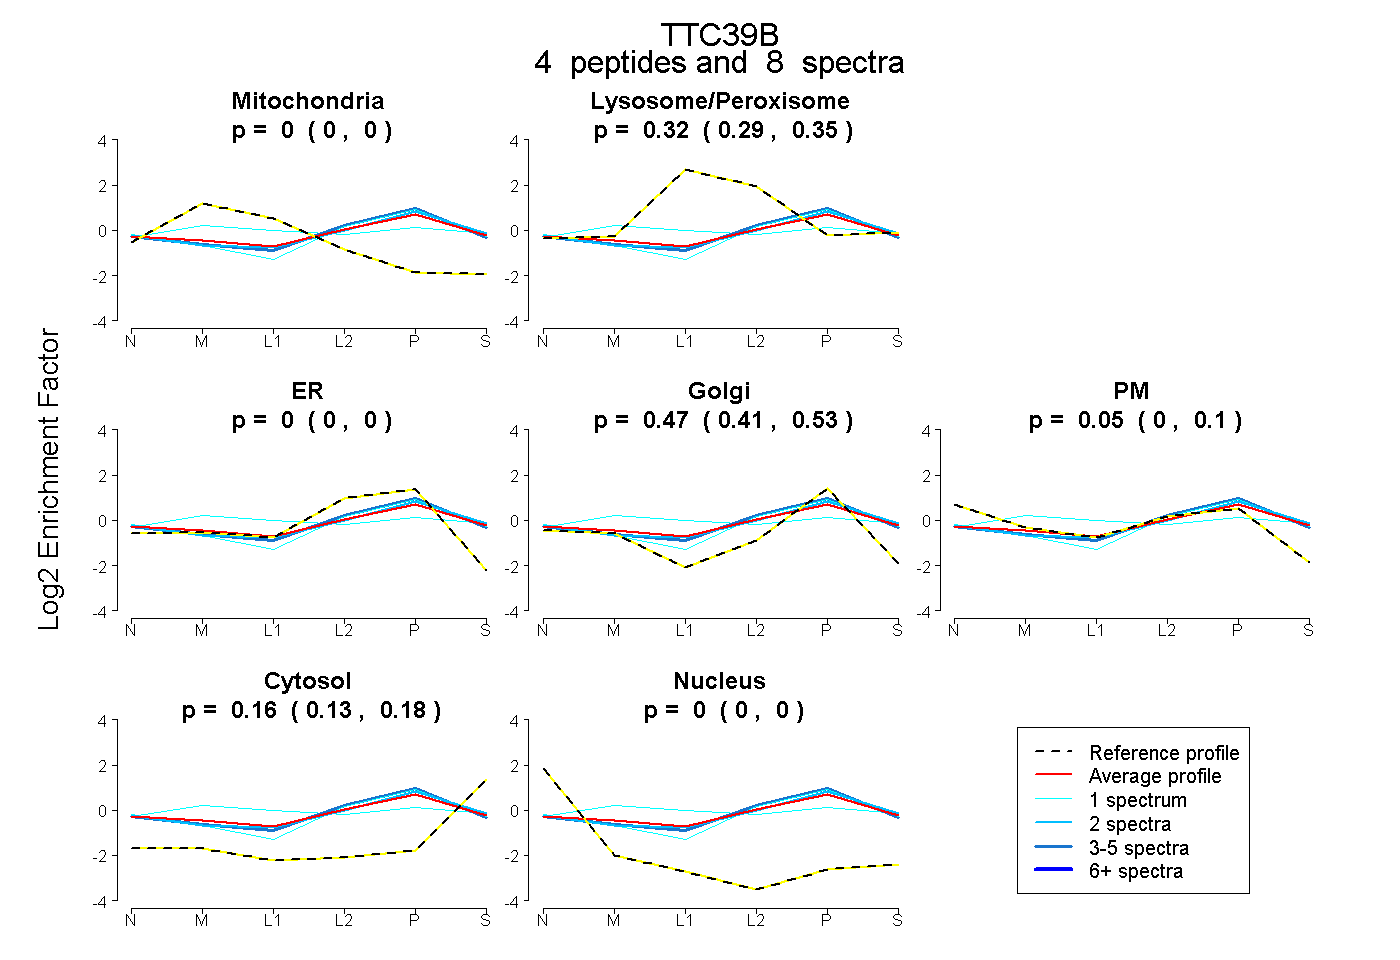
0.000 | 0.000
0.287 | 0.350
0.000 | 0.000
0.406 | 0.525
0.000 | 0.102
0.130 | 0.178
0.000 | 0.000
12peptides
spectra
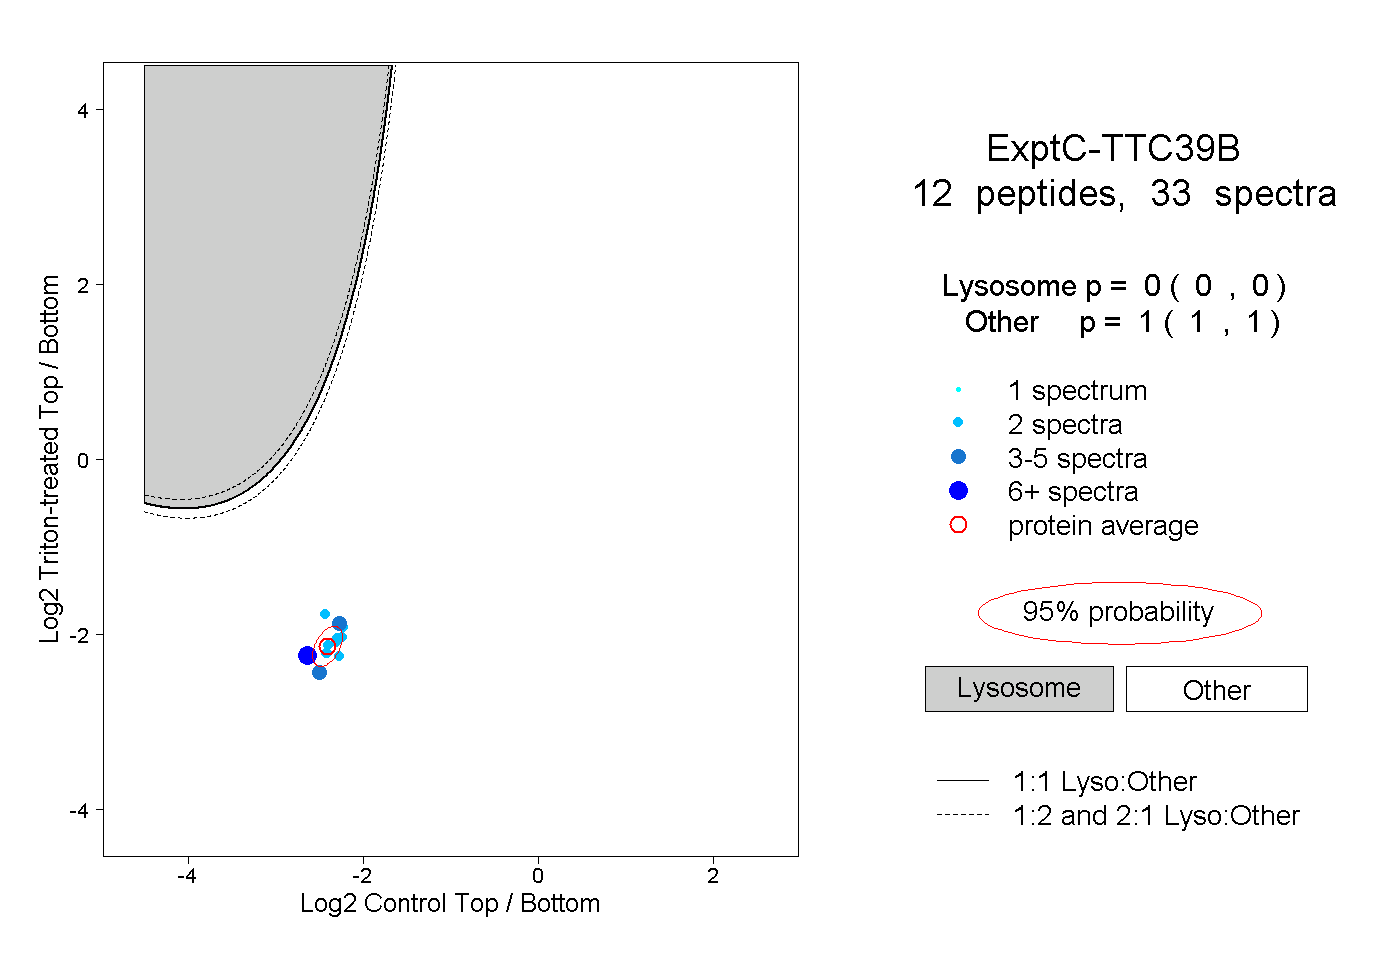
0.000 | 0.000
1.000 | 1.000
2peptides
spectra
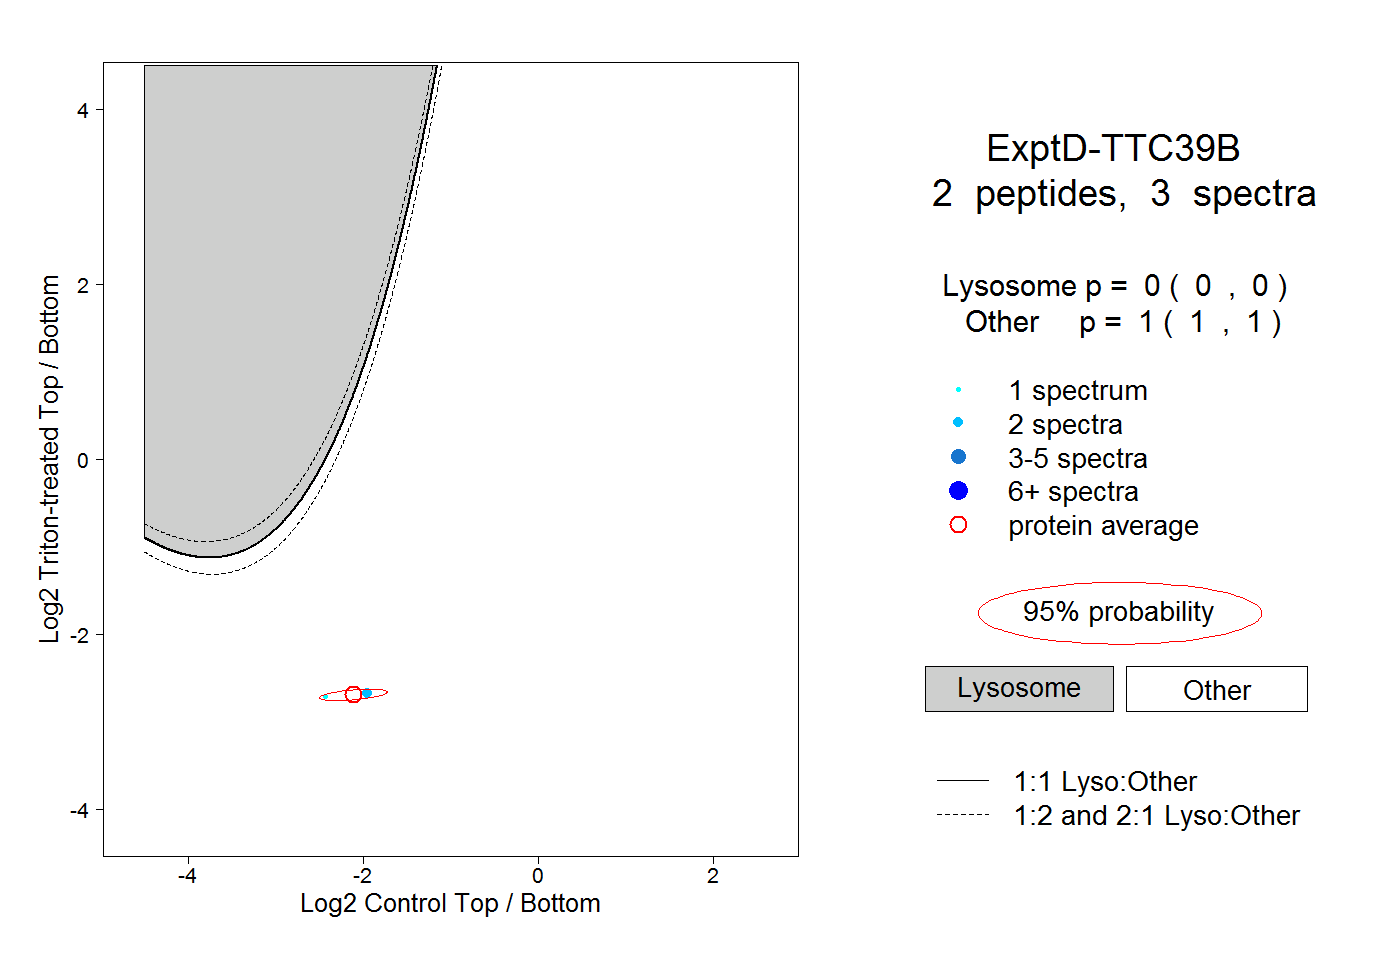
0.000 | 0.000
1.000 | 1.000