 14
14peptides
spectra
0.000 | 0.000
0.000 | 0.000
0.096 | 0.115
0.189 | 0.235
0.227 | 0.270
0.000 | 0.000
0.422 | 0.435
0.000 | 0.000
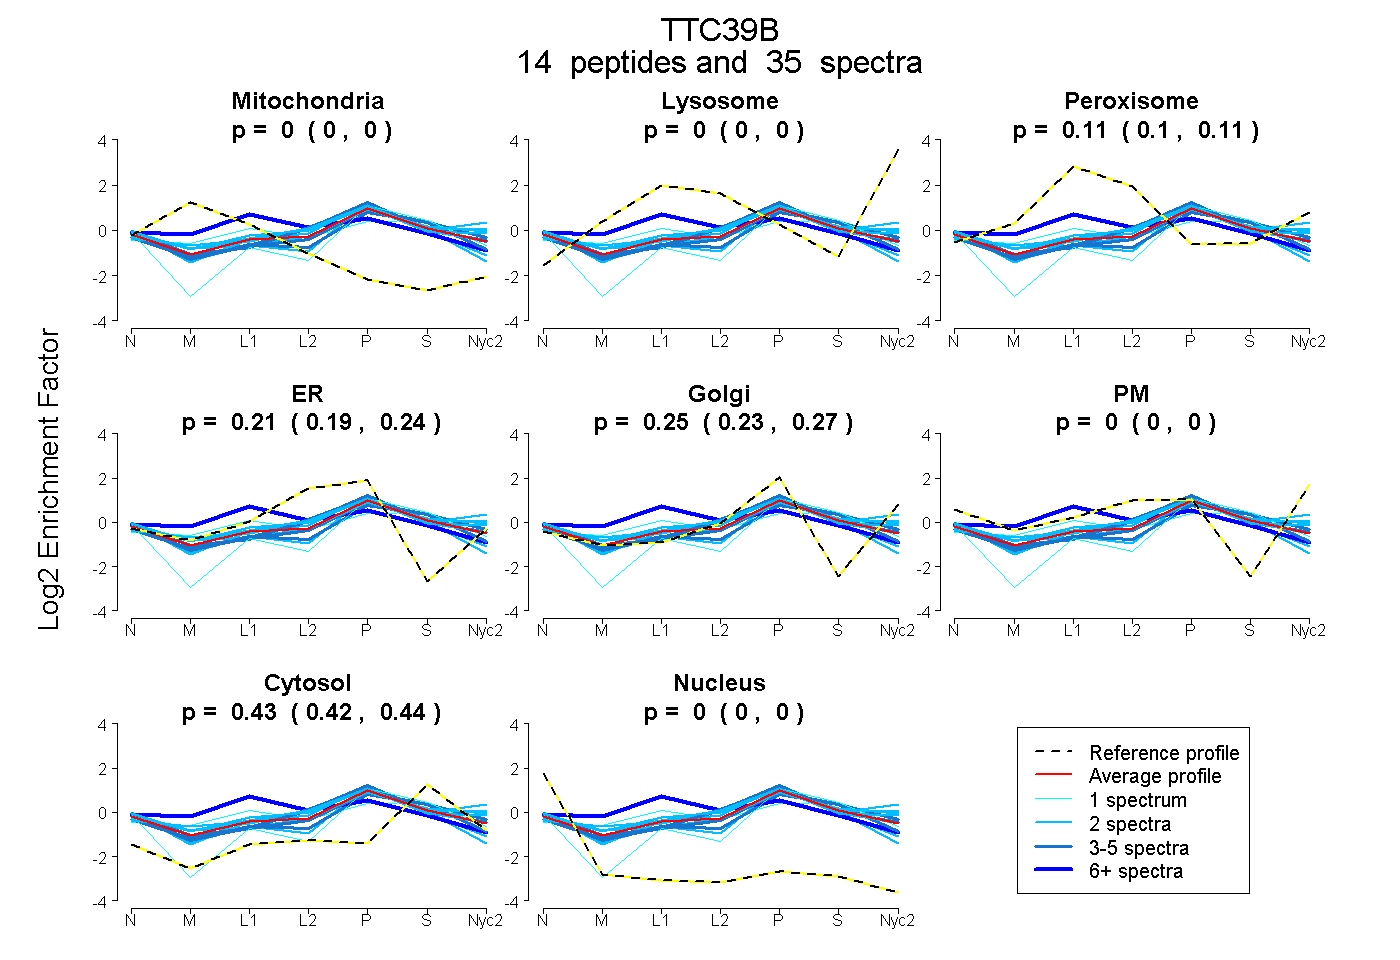
| Plot | Mito | Lyso | Perox | ER | Golgi | PM | Cytosol | Nucleus | |||||
| Expt A |
14 peptides |
35 spectra |
|
0.000 0.000 | 0.000 |
0.000 0.000 | 0.000 |
0.106 0.096 | 0.115 |
0.214 0.189 | 0.235 |
0.250 0.227 | 0.270 |
0.000 0.000 | 0.000 |
0.430 0.422 | 0.435 |
0.000 0.000 | 0.000 |
| 2 spectra, YSPSSGVPGK | 0.000 | 0.000 | 0.194 | 0.125 | 0.346 | 0.000 | 0.334 | 0.000 | ||
| 2 spectra, TSYQIYK | 0.000 | 0.000 | 0.206 | 0.000 | 0.424 | 0.000 | 0.370 | 0.000 | ||
| 2 spectra, DLSENLLVTVEK | 0.000 | 0.000 | 0.110 | 0.000 | 0.423 | 0.115 | 0.352 | 0.000 | ||
| 1 spectrum, AQETFR | 0.027 | 0.000 | 0.300 | 0.000 | 0.246 | 0.000 | 0.427 | 0.000 | ||
| 4 spectra, ENVVSLFR | 0.000 | 0.000 | 0.026 | 0.376 | 0.167 | 0.000 | 0.431 | 0.000 | ||
| 1 spectrum, QLGAPAVGR | 0.000 | 0.000 | 0.000 | 0.000 | 0.386 | 0.000 | 0.598 | 0.016 | ||
| 3 spectra, LLEFIGFSGNR | 0.000 | 0.000 | 0.020 | 0.374 | 0.128 | 0.054 | 0.423 | 0.000 | ||
| 3 spectra, DALELLRPWAK | 0.000 | 0.000 | 0.104 | 0.000 | 0.409 | 0.000 | 0.487 | 0.000 | ||
| 2 spectra, CTVVESFSSLLSR | 0.000 | 0.000 | 0.000 | 0.317 | 0.158 | 0.000 | 0.467 | 0.058 | ||
| 2 spectra, ATYVFLK | 0.056 | 0.000 | 0.000 | 0.433 | 0.055 | 0.000 | 0.456 | 0.000 | ||
| 2 spectra, VLETAR | 0.000 | 0.000 | 0.121 | 0.322 | 0.174 | 0.000 | 0.384 | 0.000 | ||
| 2 spectra, IQAALHLWK | 0.000 | 0.000 | 0.182 | 0.065 | 0.422 | 0.000 | 0.331 | 0.000 | ||
| 3 spectra, DYSLESR | 0.000 | 0.000 | 0.013 | 0.346 | 0.104 | 0.000 | 0.537 | 0.000 | ||
| 6 spectra, DALQTCQK | 0.127 | 0.000 | 0.293 | 0.297 | 0.000 | 0.000 | 0.283 | 0.000 |
| Plot | Mito | Lyso or Perox | ER | Golgi | PM | Cytosol | Nucleus | ||||||
| Expt B |
4 peptides |
8 spectra |
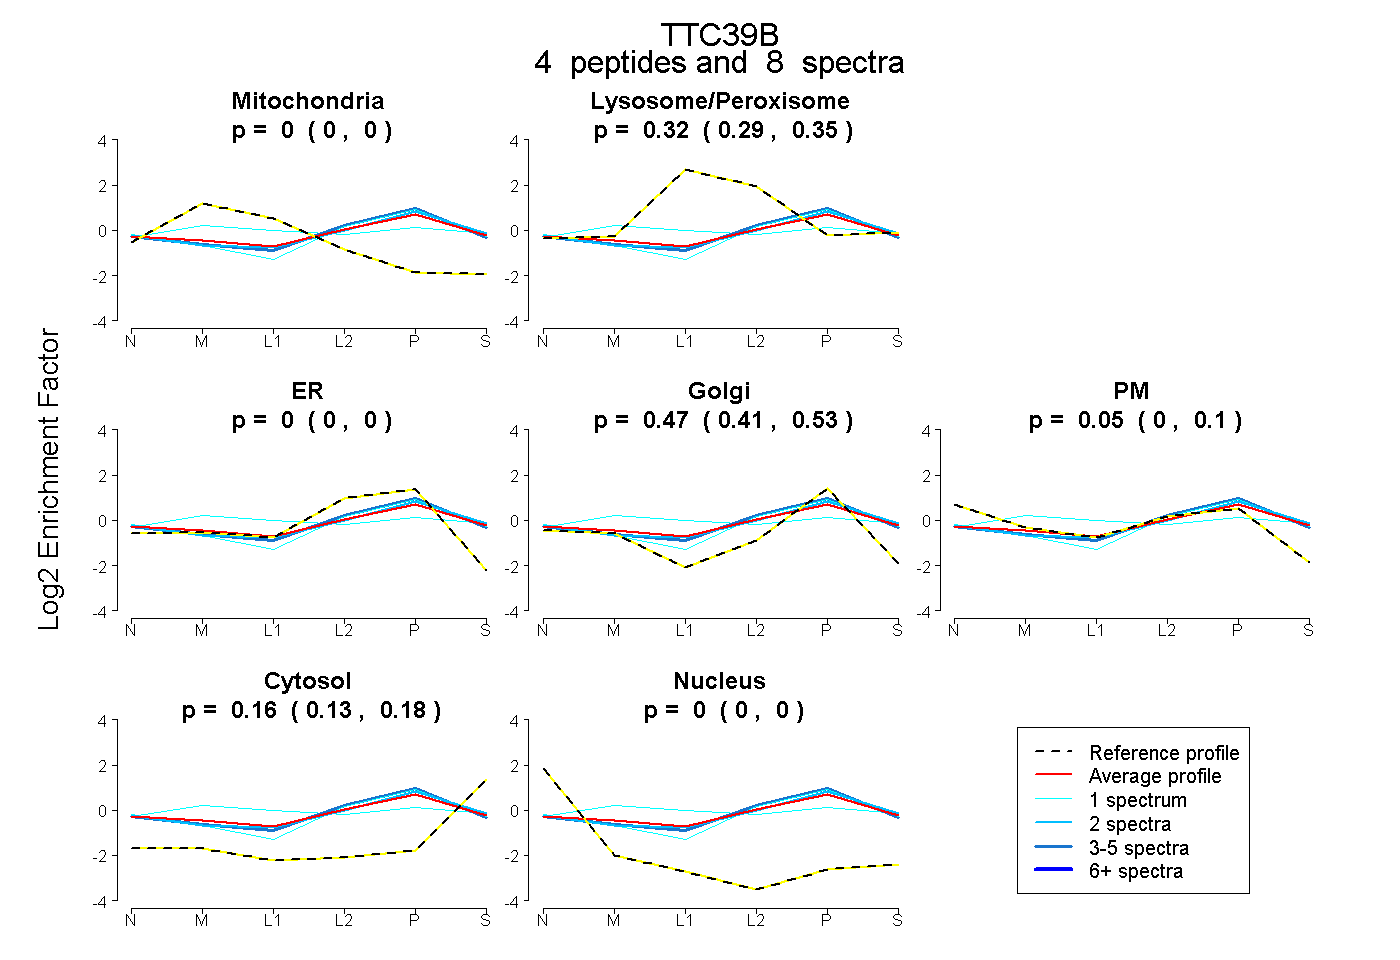 |
0.000 0.000 | 0.000 |
0.320 0.287 | 0.350 |
0.000 0.000 | 0.000 |
0.474 0.406 | 0.525 |
0.050 0.000 | 0.102 |
0.157 0.130 | 0.178 |
0.000 0.000 | 0.000 |
|||
| Plot | Lyso | Other | |||||||||||
| Expt C |
12 peptides |
33 spectra |
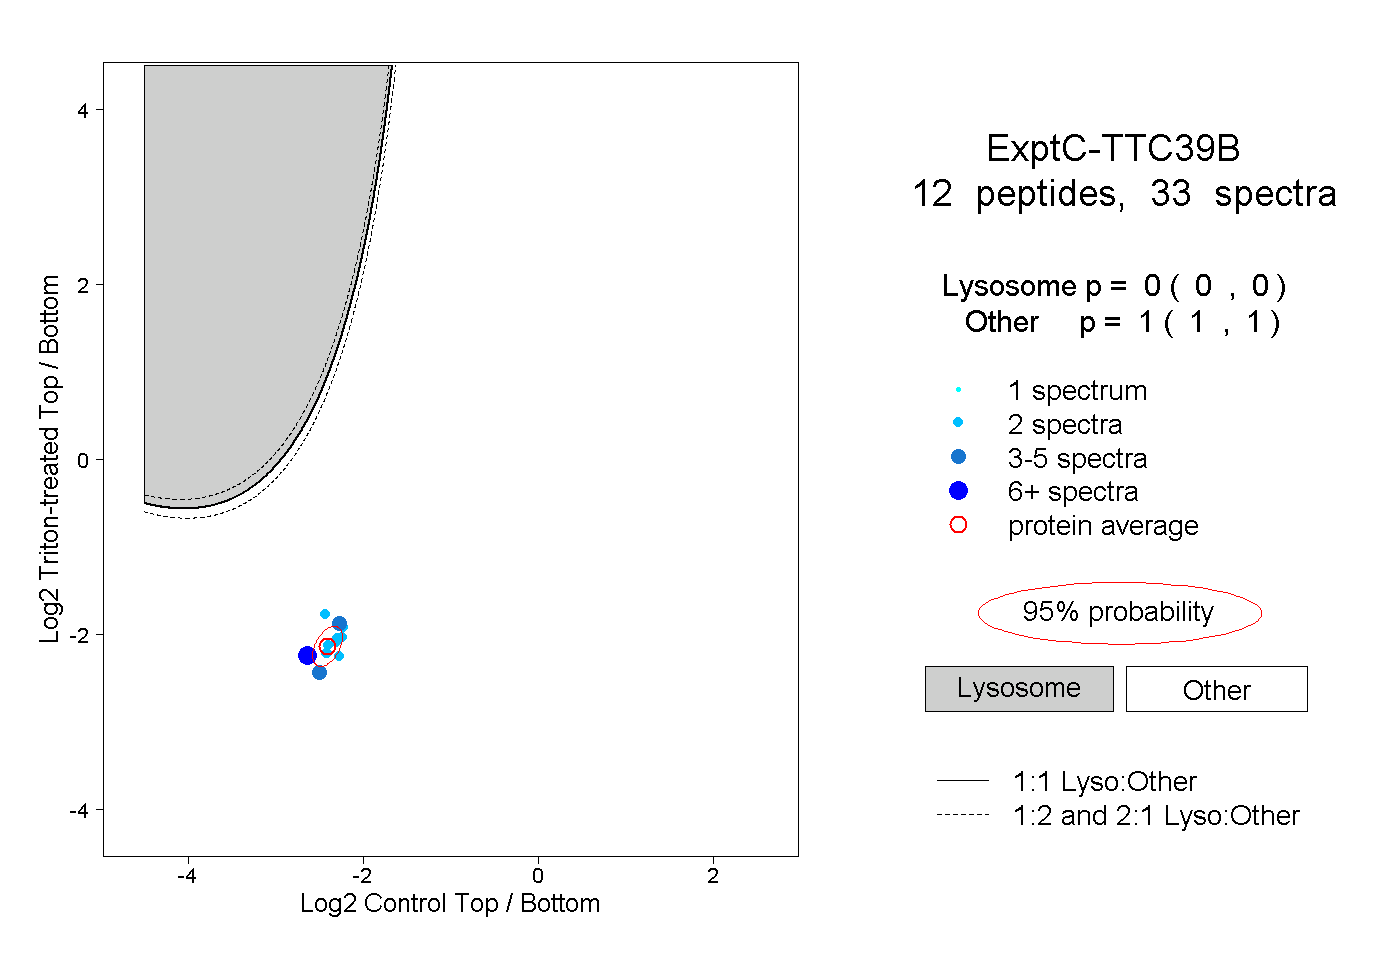 |
0.000 0.000 | 0.000 |
1.000 1.000 | 1.000 |
||||||||
| Plot | Lyso | Other | |||||||||||
| Expt D |
2 peptides |
3 spectra |
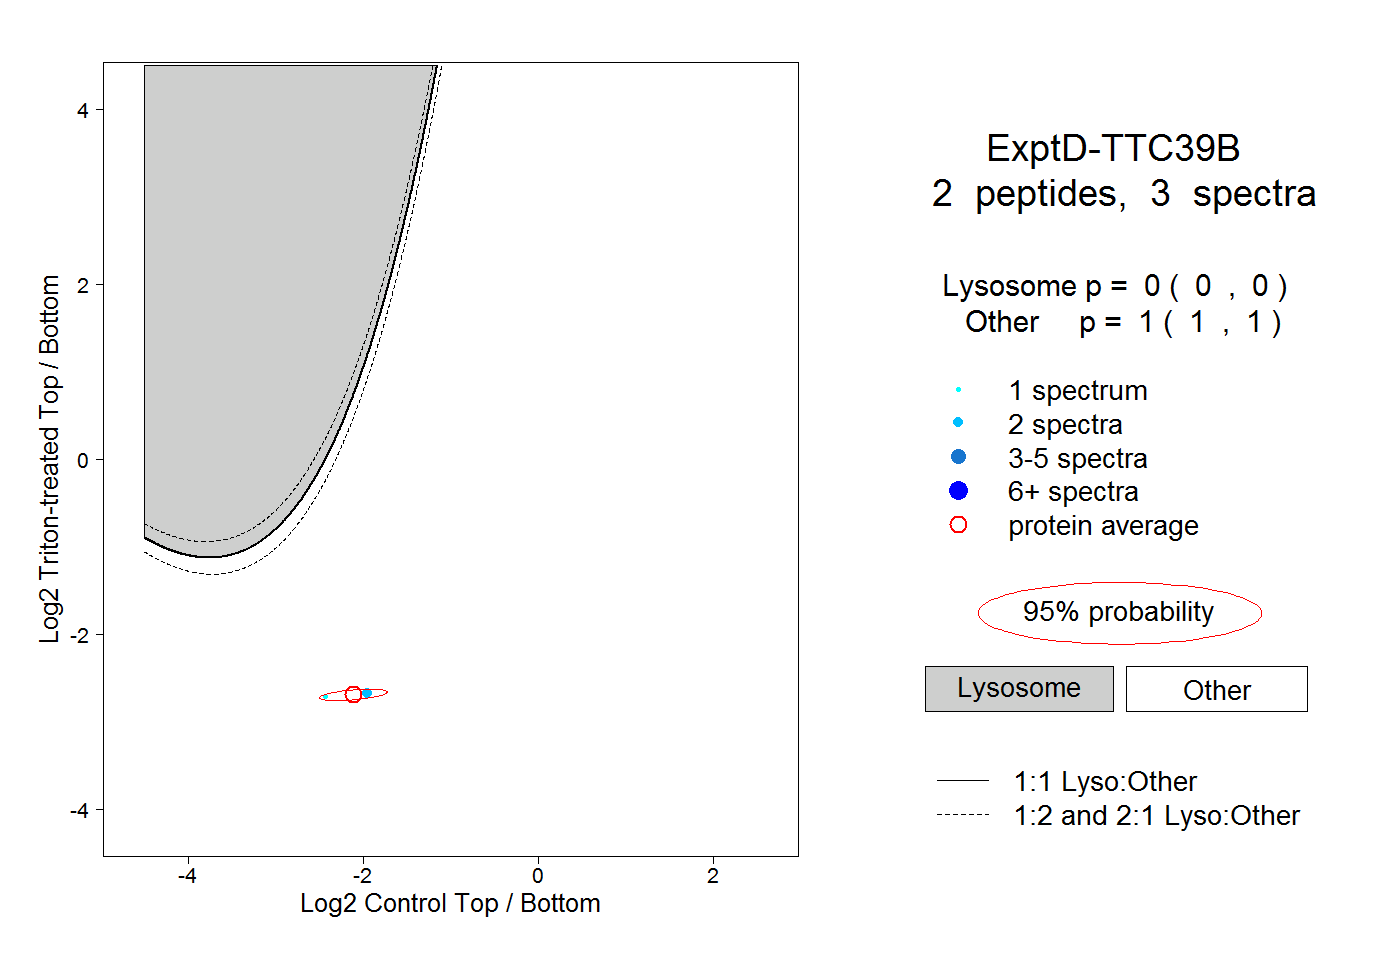 |
0.000 0.000 | 0.000 |
1.000 1.000 | 1.000 |