 9
9peptides
spectra
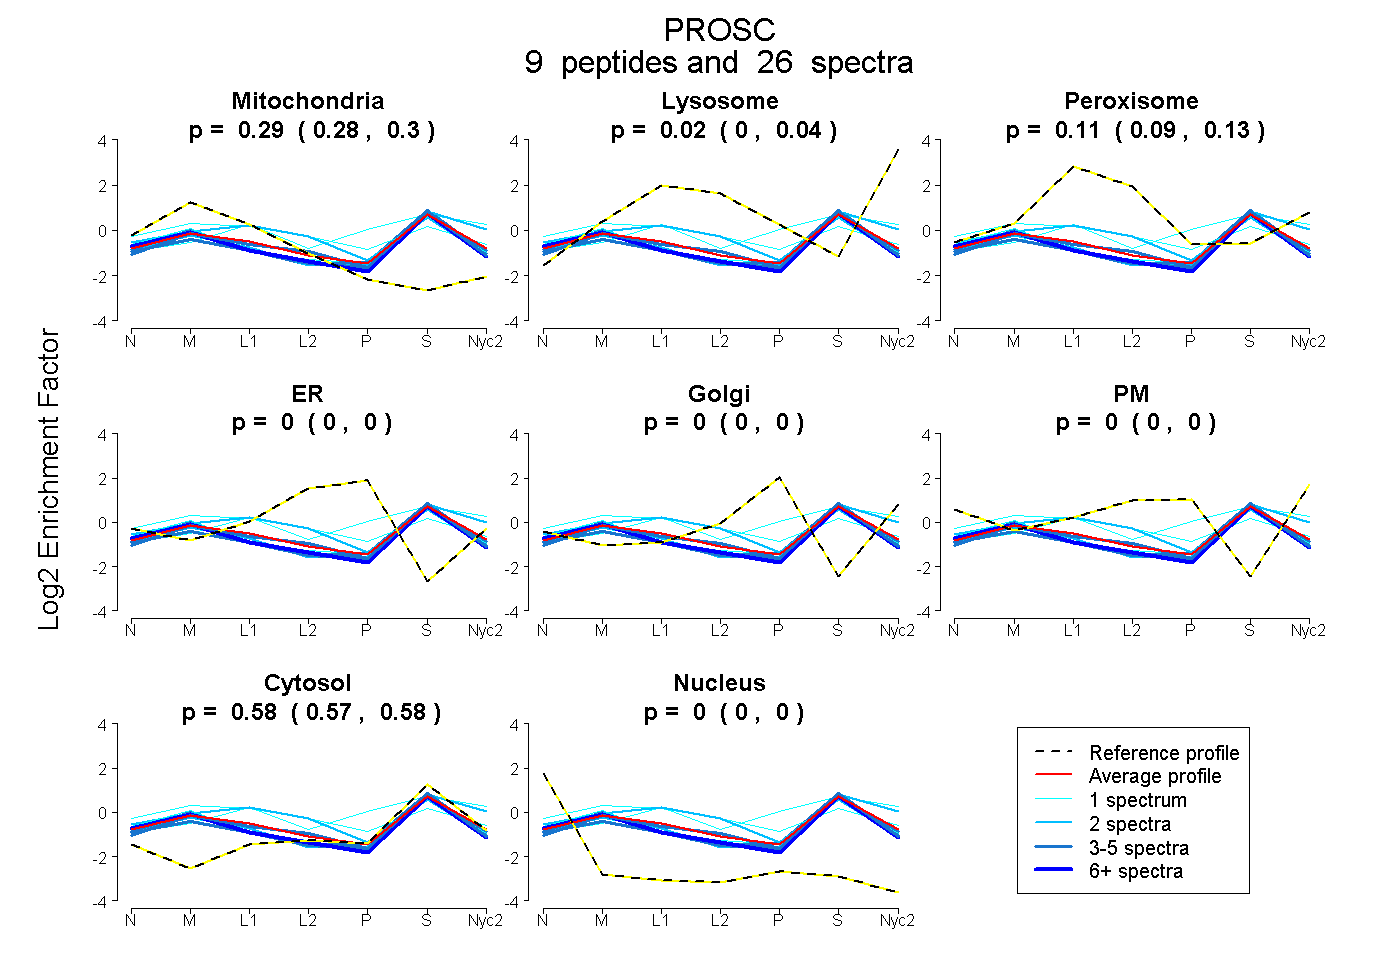
0.285 | 0.300
0.004 | 0.037
0.086 | 0.130
0.000 | 0.000
0.000 | 0.000
0.000 | 0.000
0.568 | 0.581
0.000 | 0.000
6peptides
spectra
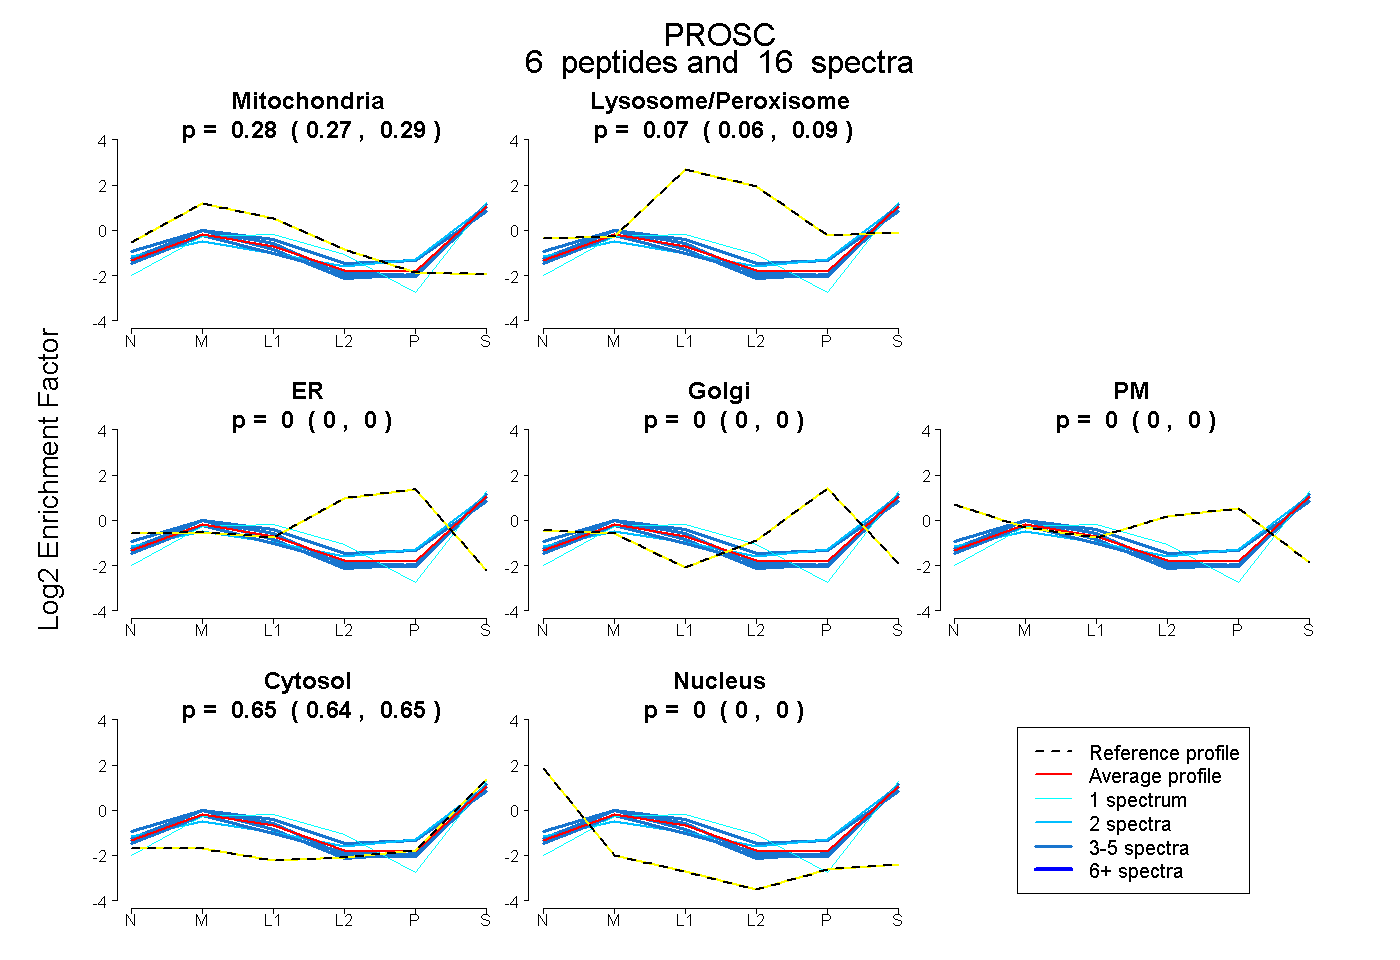
0.266 | 0.290
0.059 | 0.085
0.000 | 0.000
0.000 | 0.000
0.000 | 0.000
0.638 | 0.655
0.000 | 0.000
10peptides
spectra
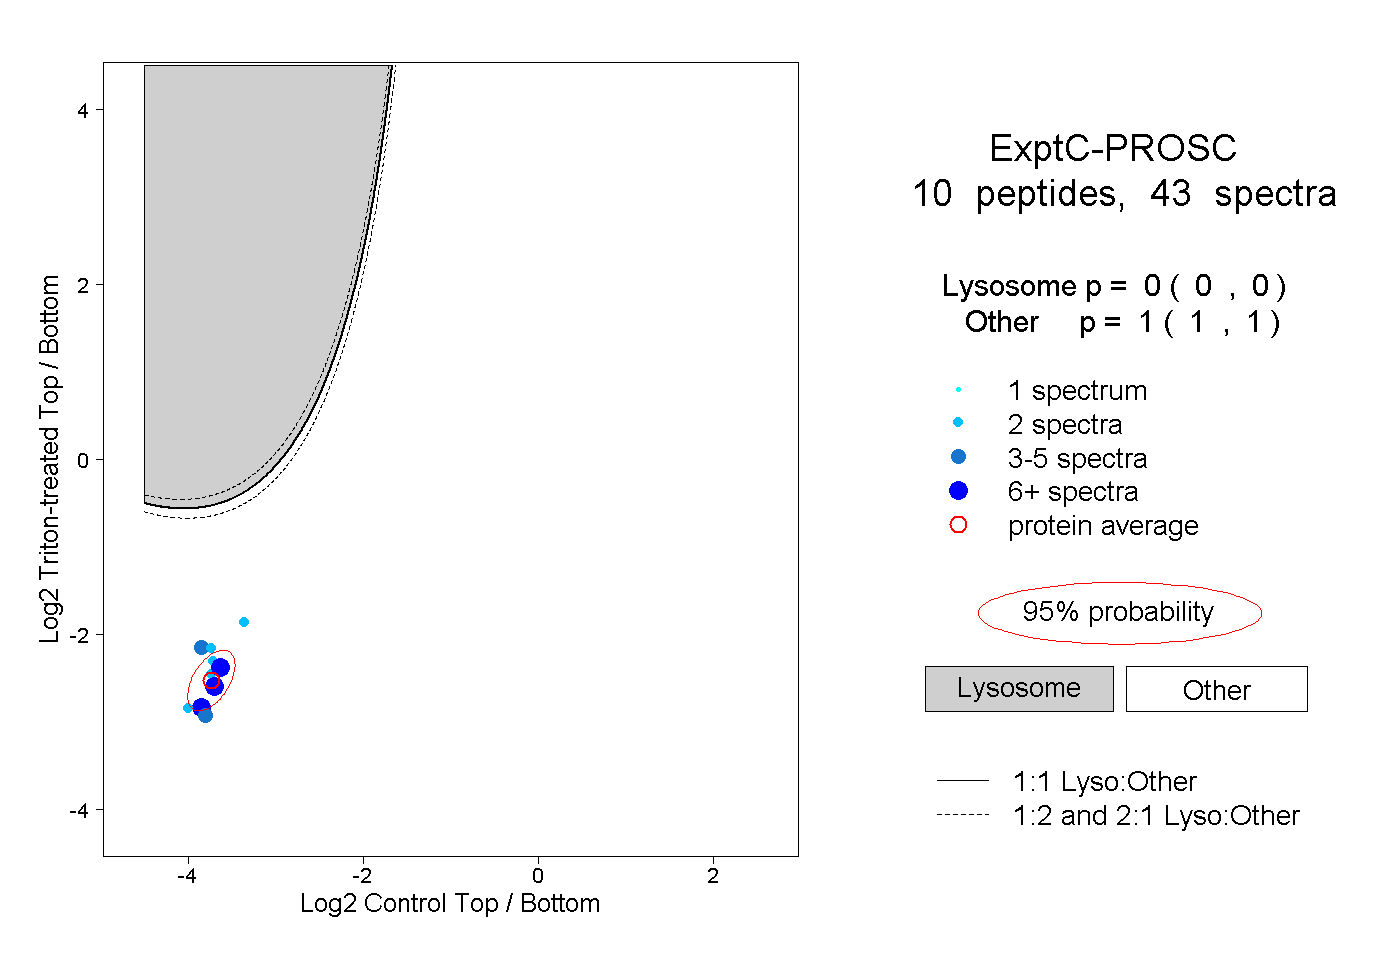
0.000 | 0.000
1.000 | 1.000
4peptides
spectra
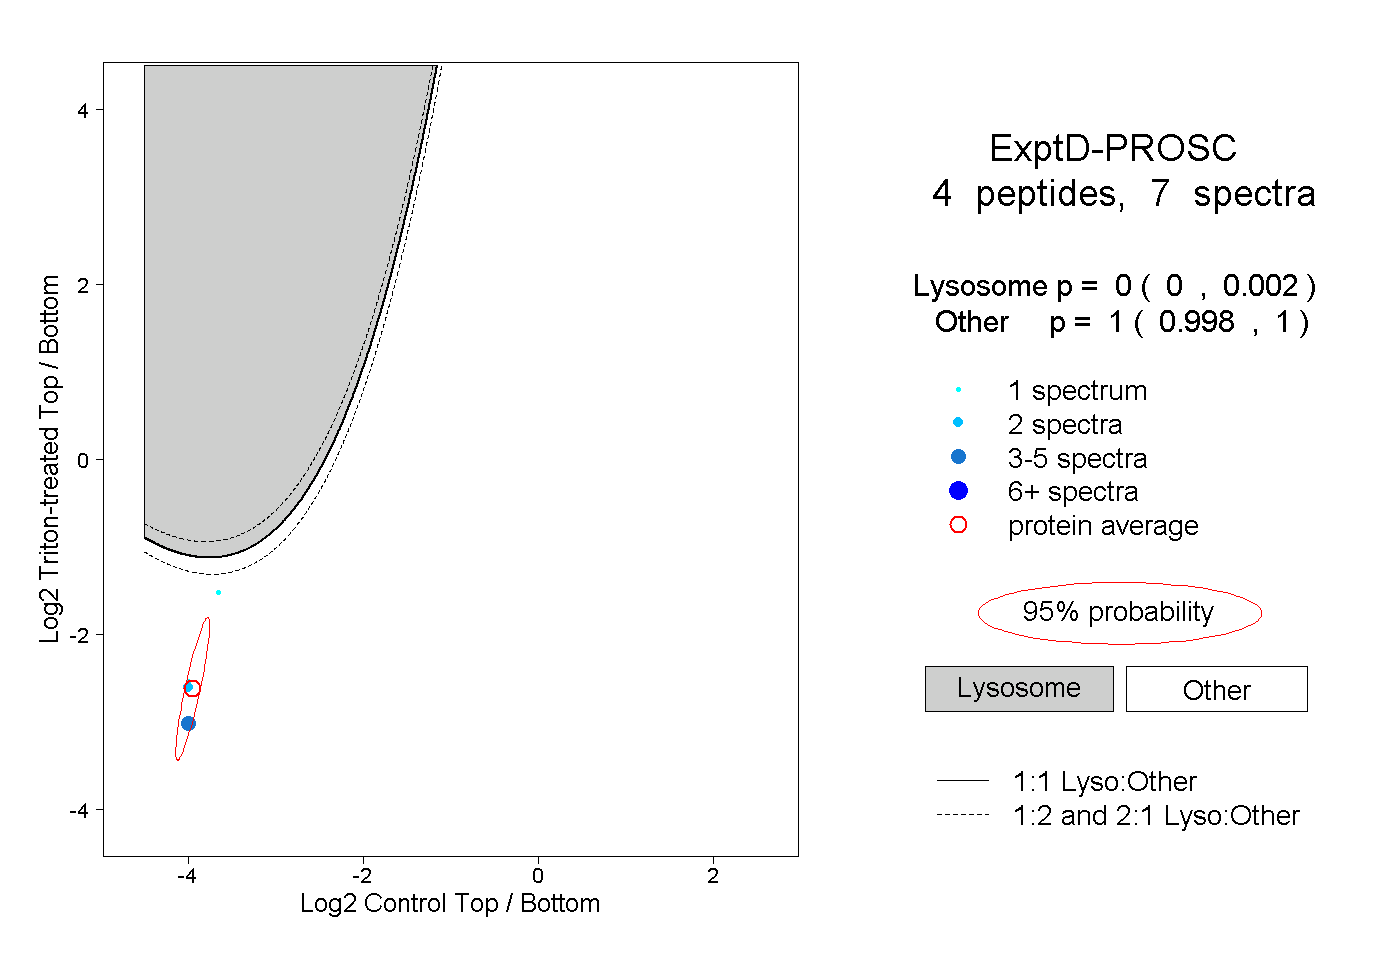
0.000 | 0.002
0.998 | 1.000