 9
9peptides
spectra
0.285 | 0.300
0.004 | 0.037
0.086 | 0.130
0.000 | 0.000
0.000 | 0.000
0.000 | 0.000
0.568 | 0.581
0.000 | 0.000
| Plot | Mito | Lyso | Perox | ER | Golgi | PM | Cytosol | Nucleus | |||||
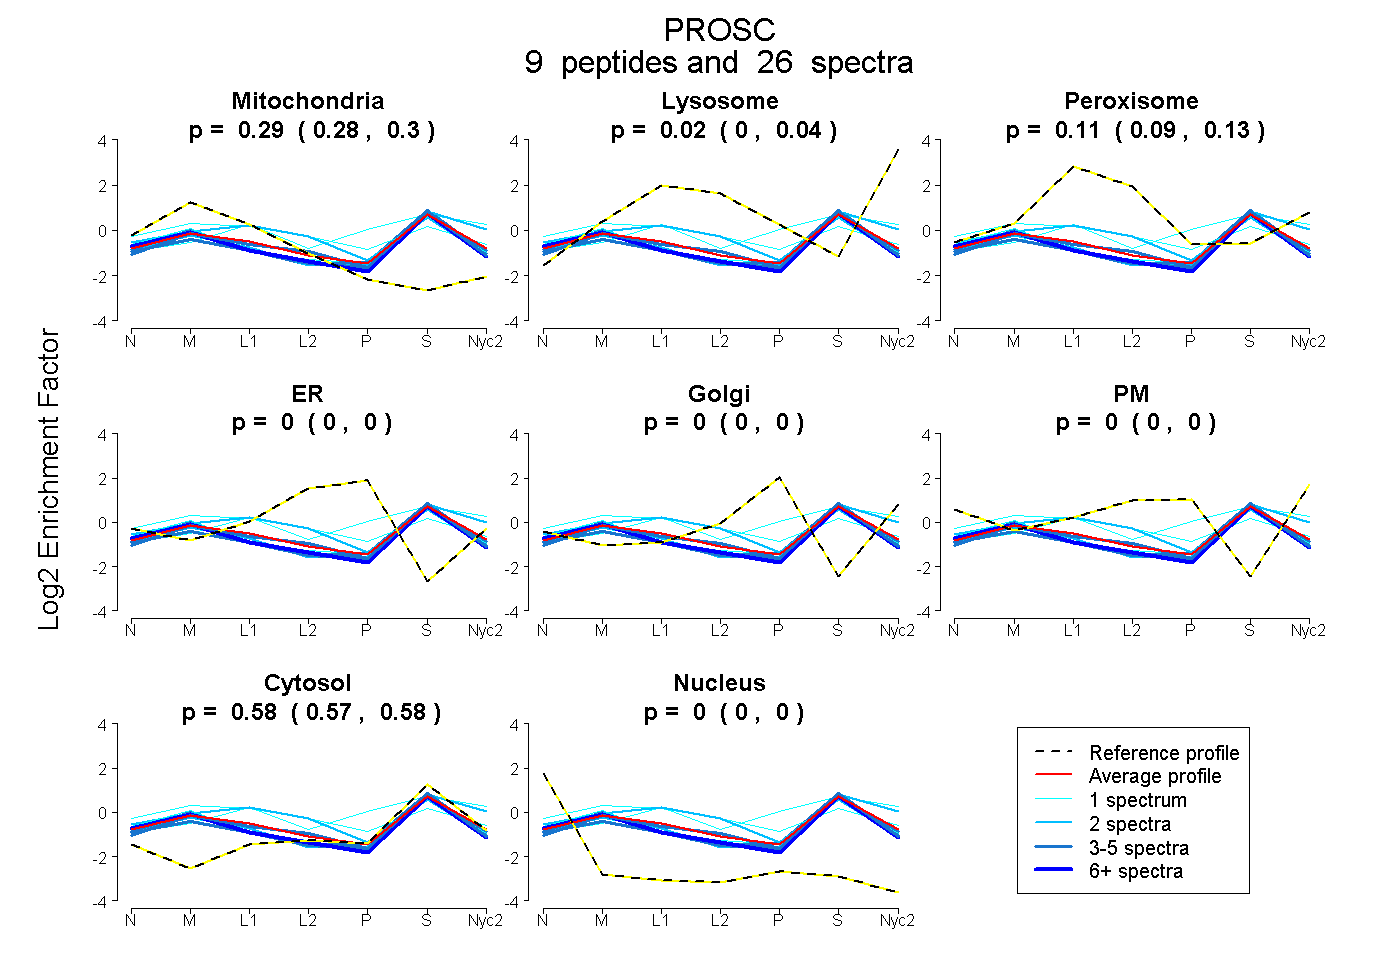
| Expt A |
9 peptides |
26 spectra |
|
0.293 0.285 | 0.300 |
0.021 0.004 | 0.037 |
0.111 0.086 | 0.130 |
0.000 0.000 | 0.000 |
0.000 0.000 | 0.000 |
0.000 0.000 | 0.000 |
0.575 0.568 | 0.581 |
0.000 0.000 | 0.000 |
| 9 spectra, VQQSVAR | 0.370 | 0.000 | 0.012 | 0.000 | 0.000 | 0.000 | 0.618 | 0.000 | ||
| 3 spectra, VGSTIFGER | 0.355 | 0.038 | 0.000 | 0.000 | 0.000 | 0.000 | 0.607 | 0.000 | ||
| 3 spectra, GLPAIQPR | 0.300 | 0.015 | 0.010 | 0.000 | 0.000 | 0.000 | 0.675 | 0.000 | ||
| 2 spectra, VMVQINTSGEDSK | 0.262 | 0.000 | 0.289 | 0.000 | 0.000 | 0.000 | 0.450 | 0.000 | ||
| 2 spectra, LMAVPNLSMLETIDSVK | 0.237 | 0.141 | 0.000 | 0.000 | 0.000 | 0.000 | 0.622 | 0.000 | ||
| 1 spectrum, TFGENYVQELLEK | 0.279 | 0.000 | 0.309 | 0.000 | 0.000 | 0.040 | 0.372 | 0.000 | ||
| 4 spectra, WHFIGHLQK | 0.295 | 0.000 | 0.103 | 0.000 | 0.000 | 0.000 | 0.602 | 0.000 | ||
| 1 spectrum, ASNPTLLSSCPEIK | 0.027 | 0.145 | 0.202 | 0.000 | 0.120 | 0.000 | 0.506 | 0.000 | ||
| 1 spectrum, VNSSWQK | 0.374 | 0.045 | 0.000 | 0.000 | 0.000 | 0.000 | 0.581 | 0.000 |
| Plot | Mito | Lyso or Perox | ER | Golgi | PM | Cytosol | Nucleus | ||||||
| Expt B |
6 peptides |
16 spectra |
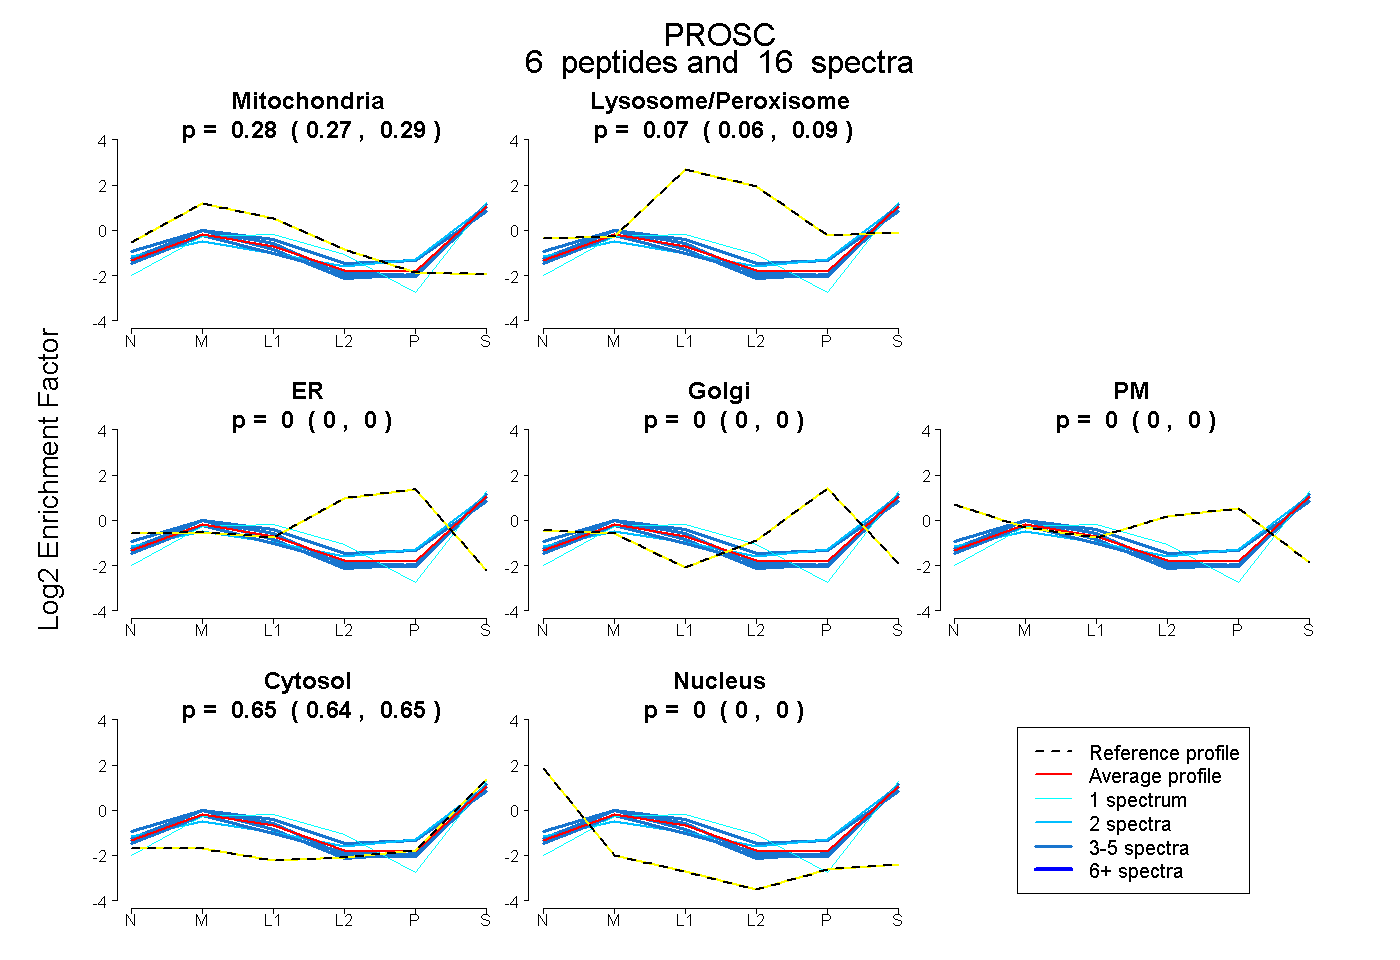 |
0.279 0.266 | 0.290 |
0.074 0.059 | 0.085 |
0.000 0.000 | 0.000 |
0.000 0.000 | 0.000 |
0.000 0.000 | 0.000 |
0.647 0.638 | 0.655 |
0.000 0.000 | 0.000 |
|||
| Plot | Lyso | Other | |||||||||||
| Expt C |
10 peptides |
43 spectra |
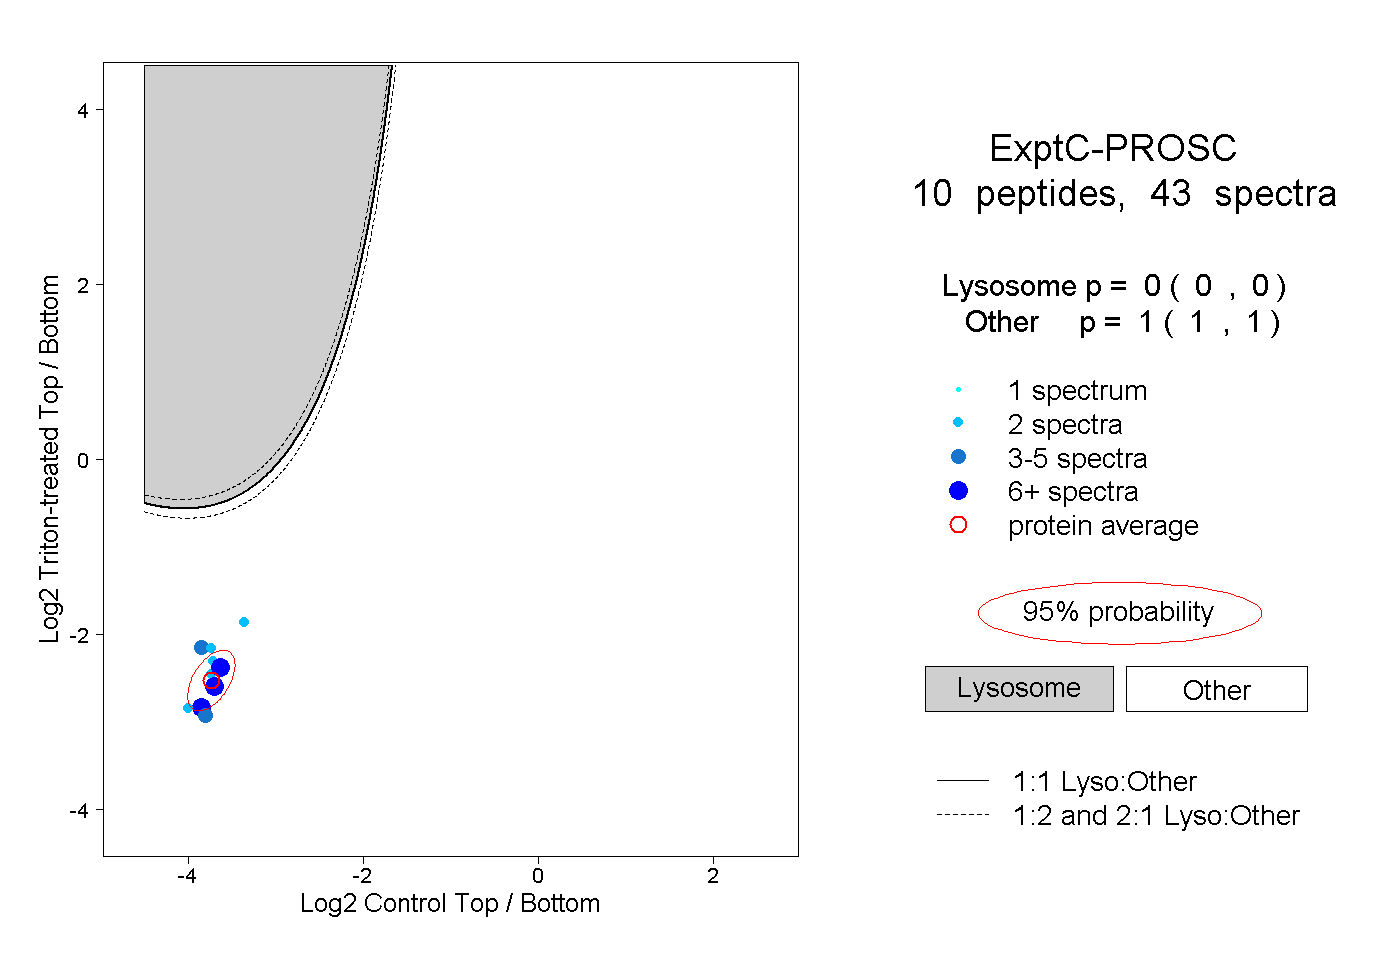 |
0.000 0.000 | 0.000 |
1.000 1.000 | 1.000 |
||||||||
| Plot | Lyso | Other | |||||||||||
| Expt D |
4 peptides |
7 spectra |
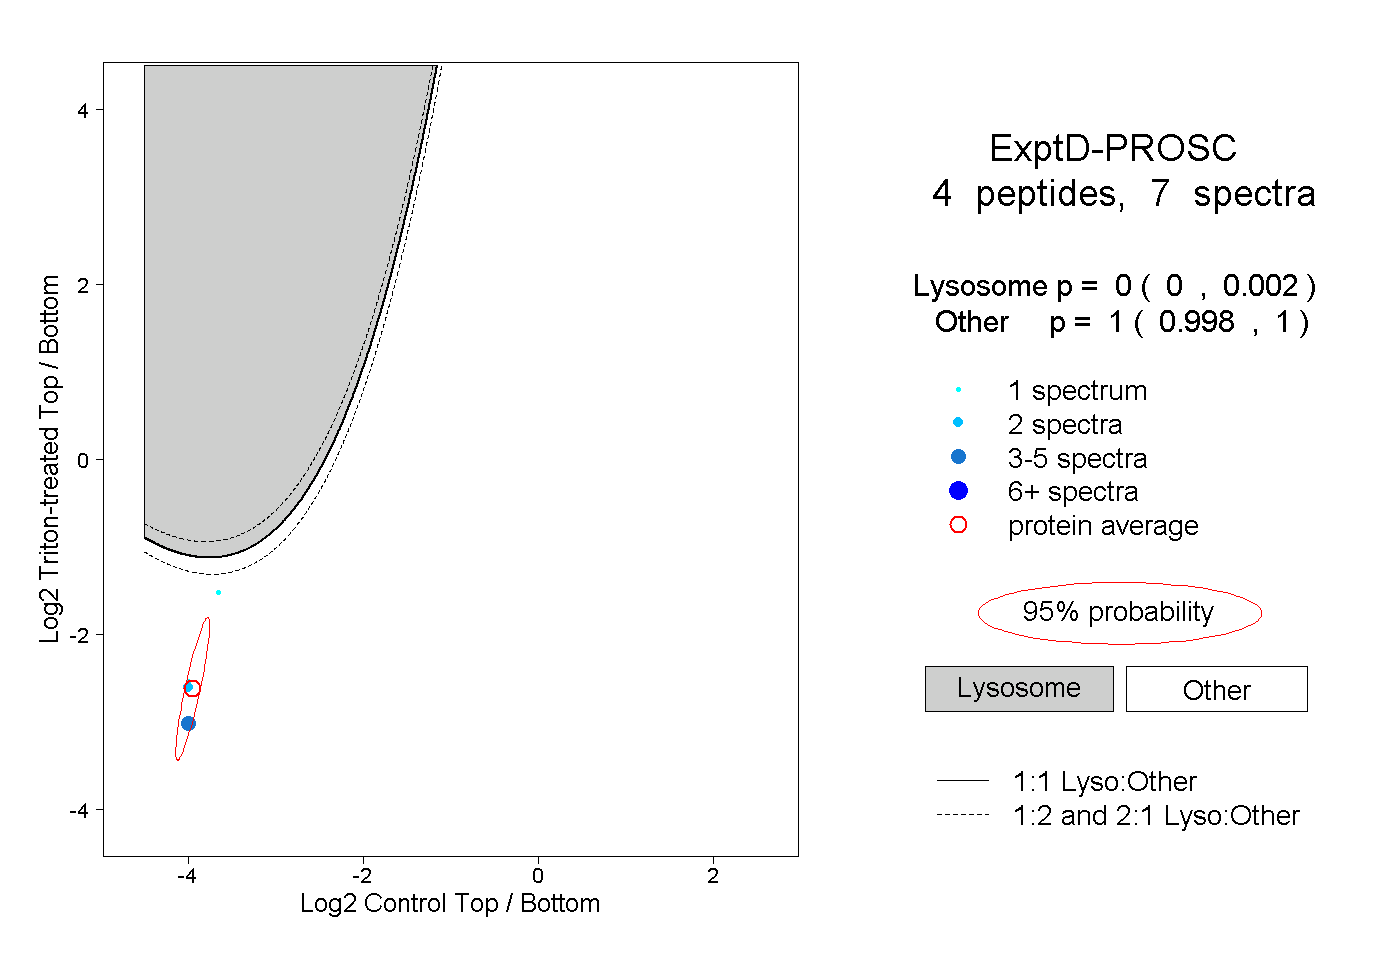 |
0.000 0.000 | 0.002 |
1.000 0.998 | 1.000 |