 2
2peptides
spectra
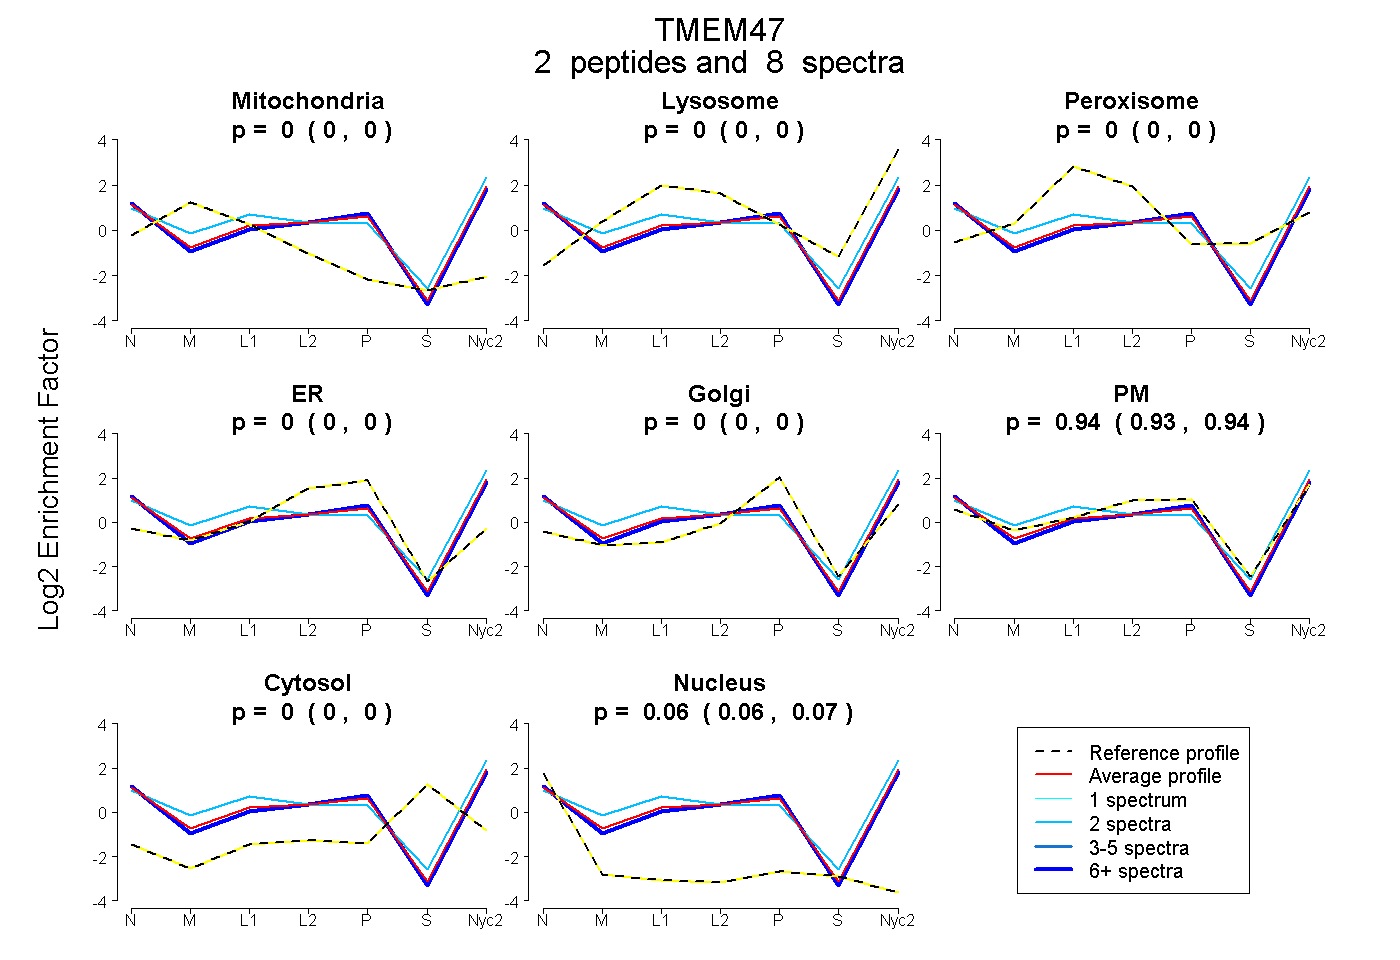
0.000 | 0.000
0.000 | 0.000
0.000 | 0.000
0.000 | 0.000
0.000 | 0.000
0.930 | 0.944
0.000 | 0.000
0.055 | 0.069
2peptides
spectra
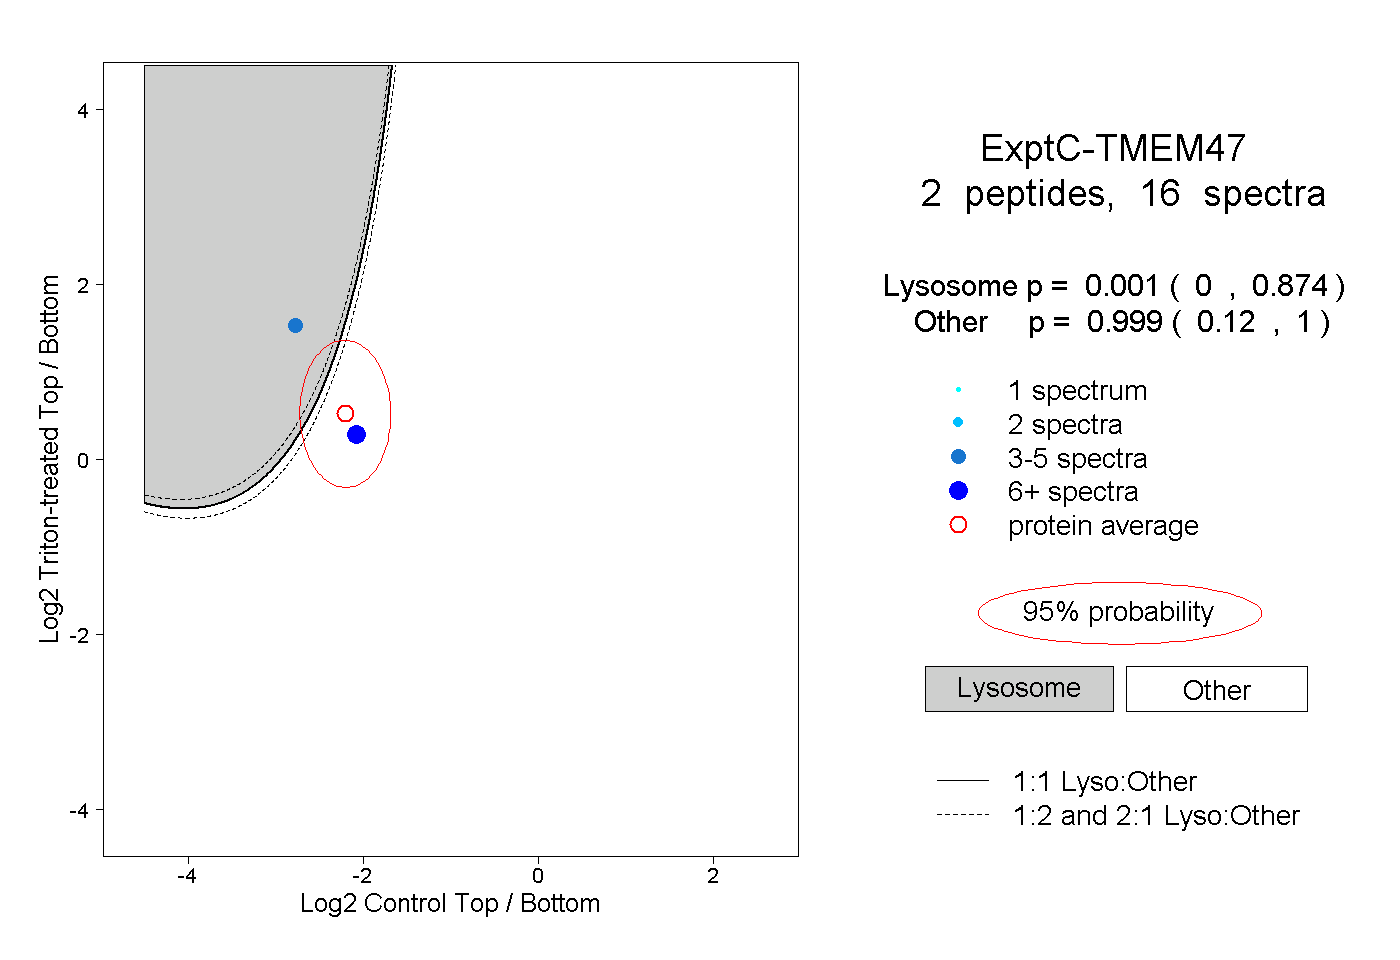
0.000 | 0.874
0.120 | 1.000
1peptide
spectra
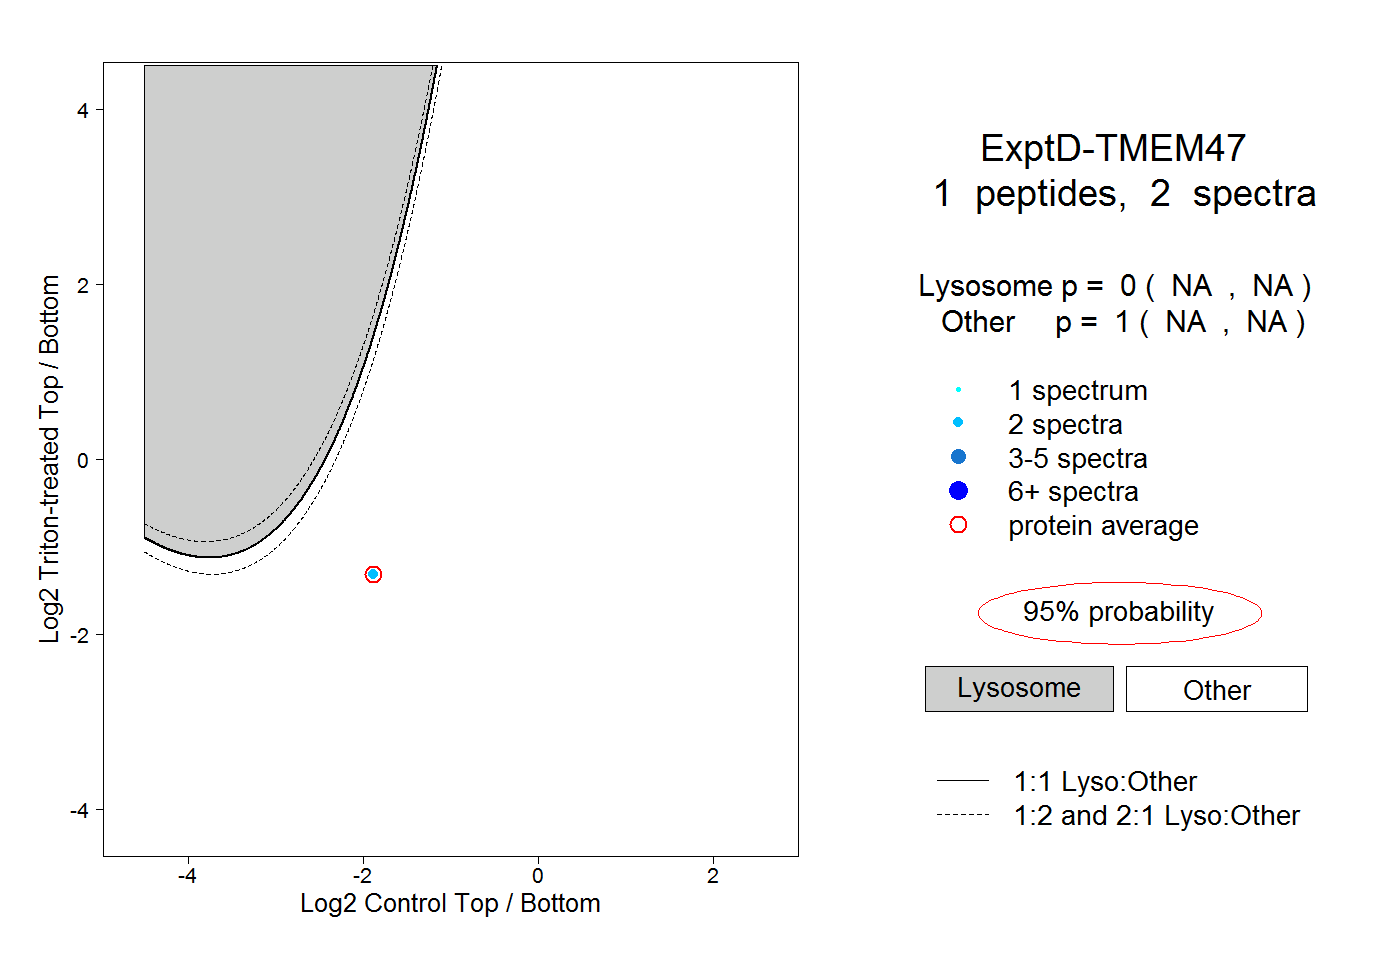
NA | NA
NA | NA