 2
2peptides
spectra
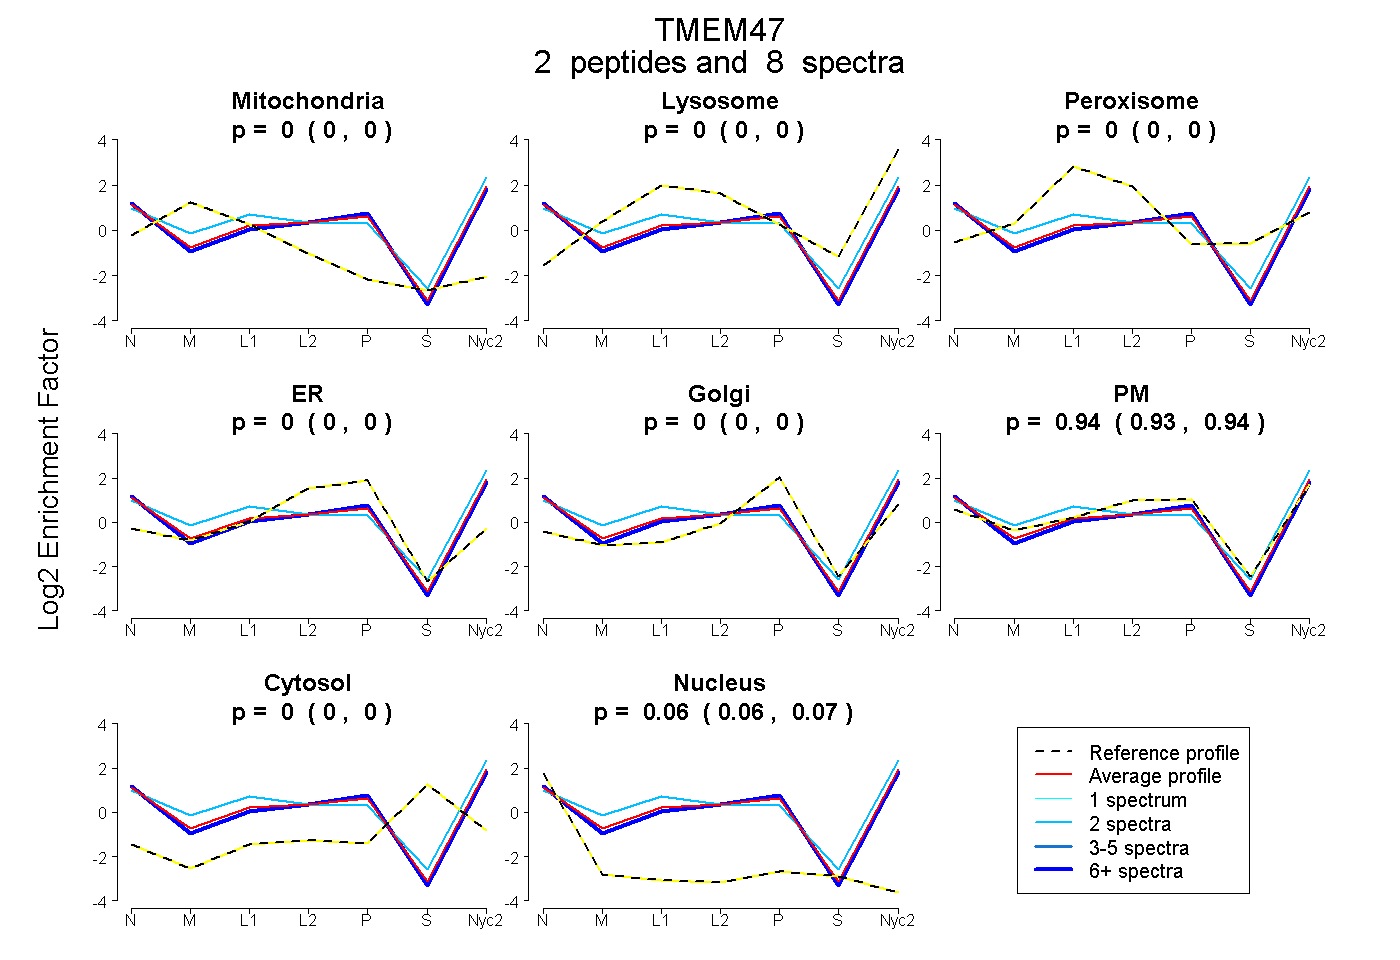
0.000 | 0.000
0.000 | 0.000
0.000 | 0.000
0.000 | 0.000
0.000 | 0.000
0.930 | 0.944
0.000 | 0.000
0.055 | 0.069
| Plot | Mito | Lyso | Perox | ER | Golgi | PM | Cytosol | Nucleus | |||||
| Expt A |
2 peptides |
8 spectra |
|
0.000 0.000 | 0.000 |
0.000 0.000 | 0.000 |
0.000 0.000 | 0.000 |
0.000 0.000 | 0.000 |
0.000 0.000 | 0.000 |
0.938 0.930 | 0.944 |
0.000 0.000 | 0.000 |
0.062 0.055 | 0.069 |
| 2 spectra, VSVLTPLK | 0.022 | 0.151 | 0.000 | 0.000 | 0.000 | 0.792 | 0.000 | 0.035 | ||
| 6 spectra, ASAGSGMEEVR | 0.000 | 0.000 | 0.000 | 0.000 | 0.000 | 0.919 | 0.000 | 0.081 |
| Plot | Lyso | Other | |||||||||||
| Expt C |
2 peptides |
16 spectra |
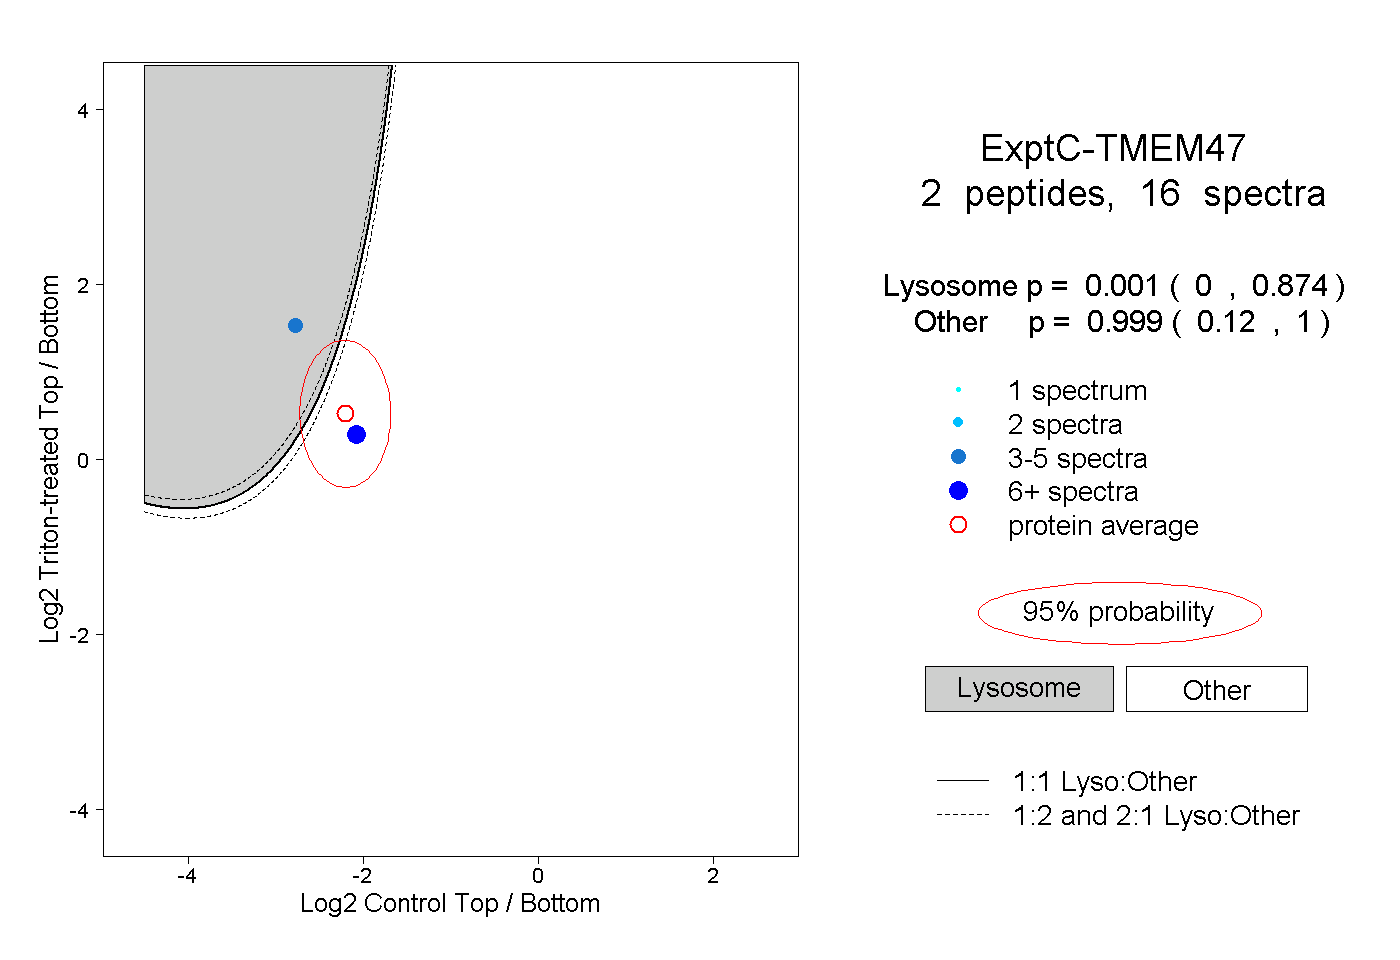 |
0.001 0.000 | 0.874 |
0.999 0.120 | 1.000 |
||||||||
| Plot | Lyso | Other | |||||||||||
| Expt D |
1 peptide |
2 spectra |
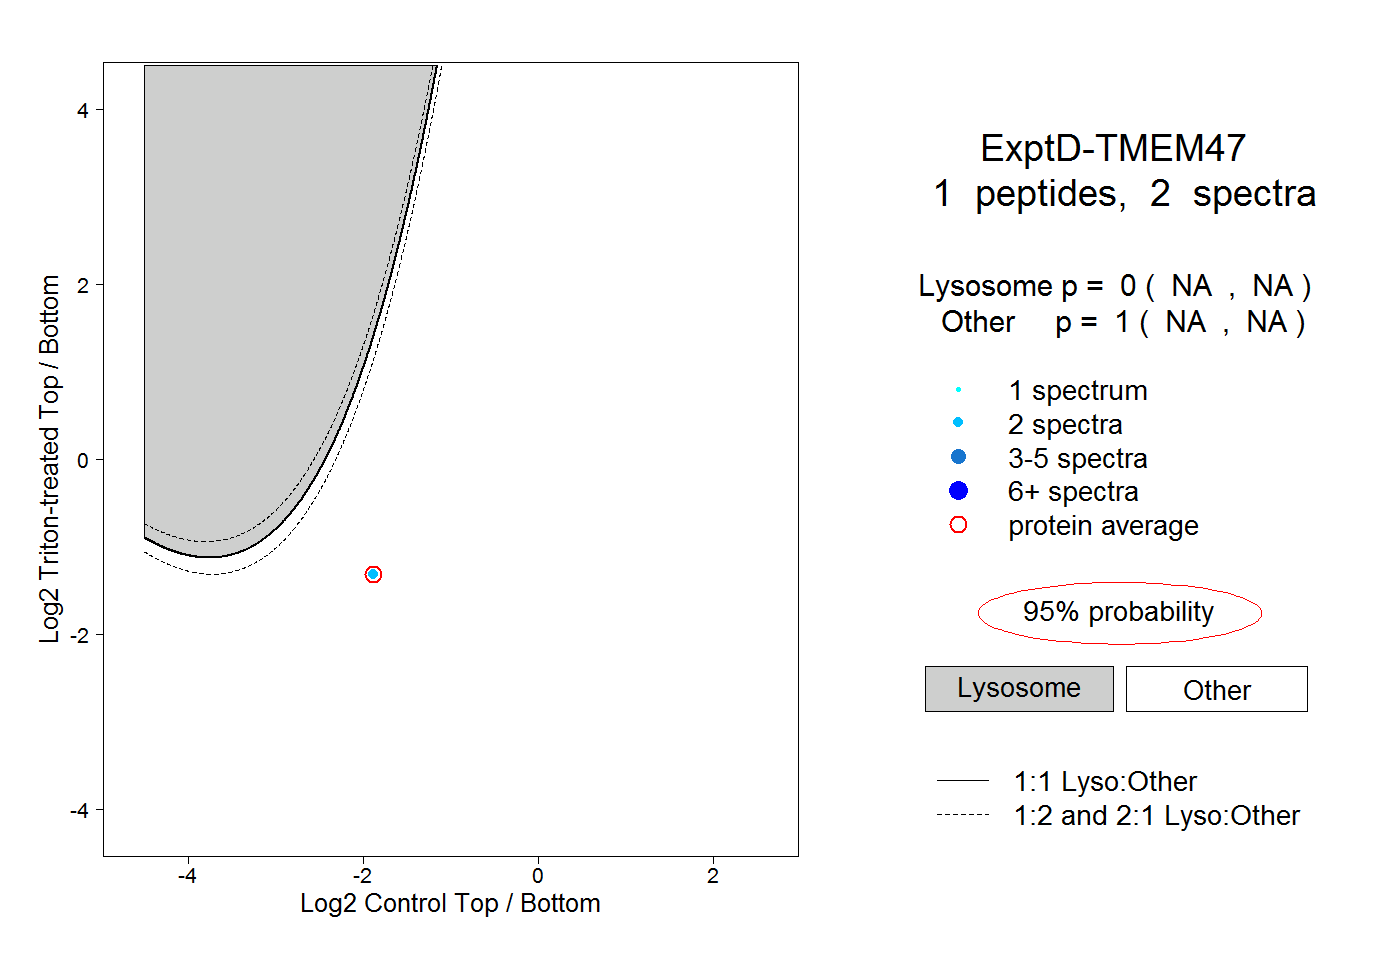 |
0.000 NA | NA |
1.000 NA | NA |