 10
10peptides
spectra
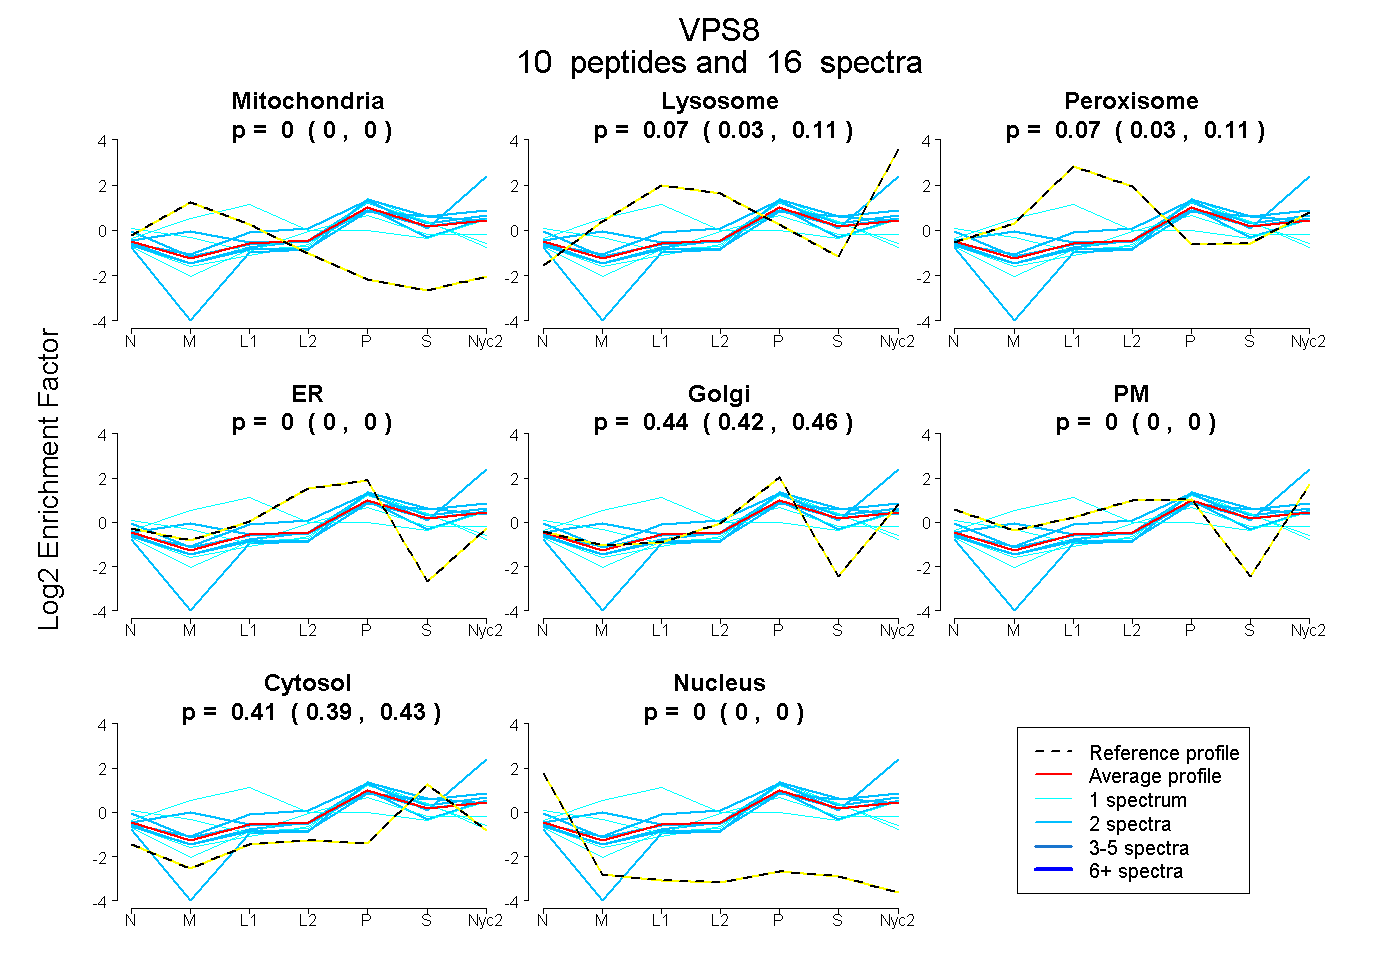
0.000 | 0.000
0.026 | 0.106
0.031 | 0.107
0.000 | 0.000
0.423 | 0.459
0.000 | 0.000
0.395 | 0.427
0.000 | 0.000
2peptides
spectra
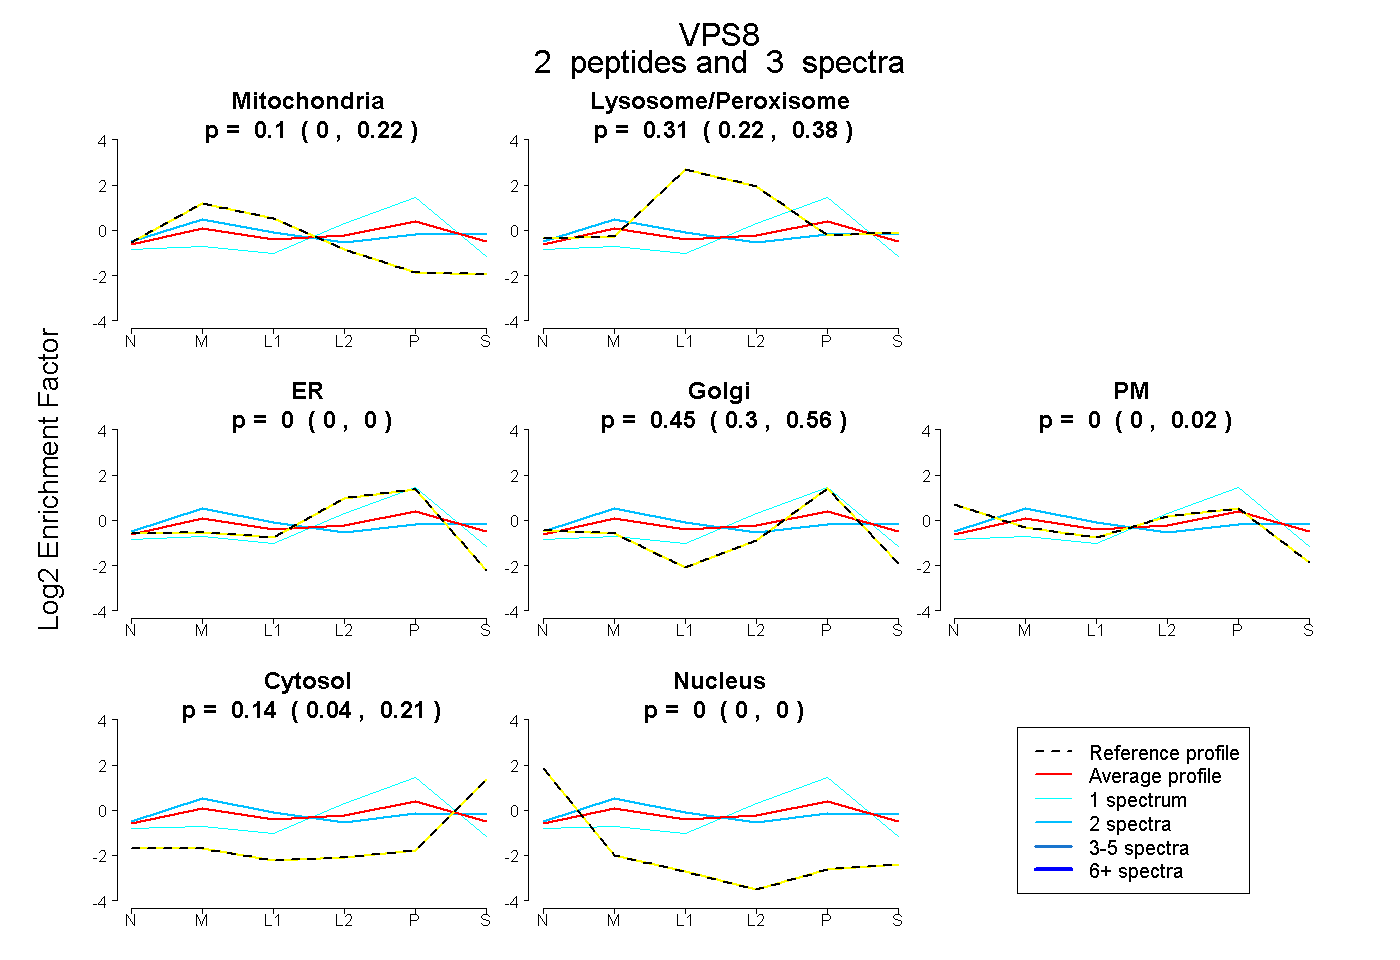
0.000 | 0.219
0.221 | 0.375
0.000 | 0.000
0.302 | 0.560
0.000 | 0.017
0.045 | 0.206
0.000 | 0.000
3peptides
spectra
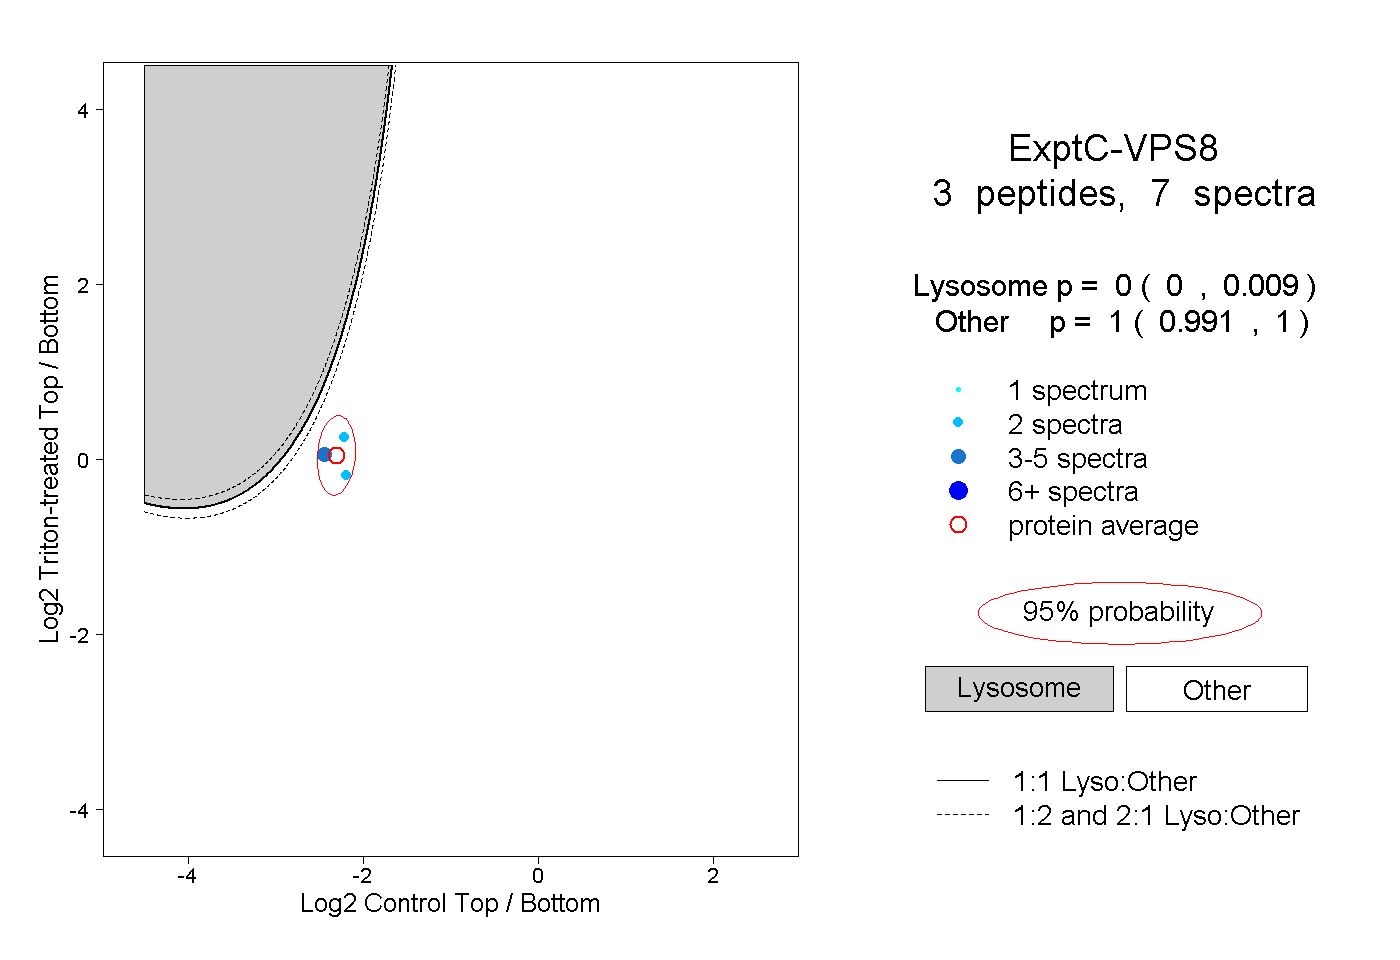
0.000 | 0.009
0.991 | 1.000