 10
10peptides
spectra
0.000 | 0.000
0.026 | 0.106
0.031 | 0.107
0.000 | 0.000
0.423 | 0.459
0.000 | 0.000
0.395 | 0.427
0.000 | 0.000
| Plot | Mito | Lyso | Perox | ER | Golgi | PM | Cytosol | Nucleus | |||||
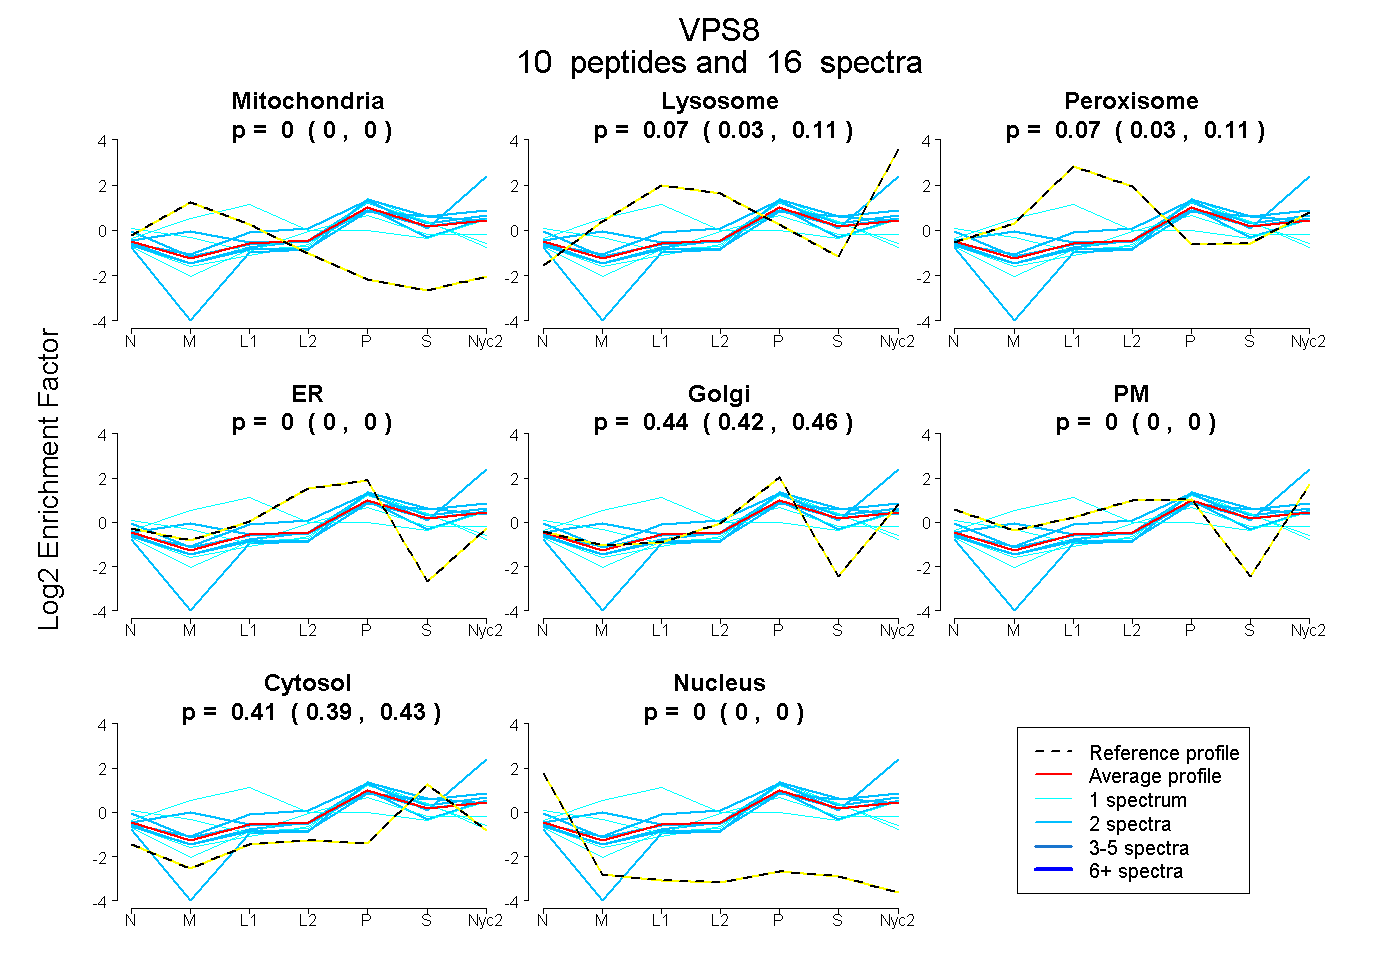
| Expt A |
10 peptides |
16 spectra |
|
0.000 0.000 | 0.000 |
0.069 0.026 | 0.106 |
0.074 0.031 | 0.107 |
0.000 0.000 | 0.000 |
0.444 0.423 | 0.459 |
0.000 0.000 | 0.000 |
0.412 0.395 | 0.427 |
0.000 0.000 | 0.000 |
| 1 spectrum, LLCGFAK | 0.070 | 0.000 | 0.006 | 0.131 | 0.124 | 0.284 | 0.386 | 0.000 | ||
| 2 spectra, ILVIGLKPSLK | 0.000 | 0.000 | 0.000 | 0.000 | 0.395 | 0.000 | 0.605 | 0.000 | ||
| 1 spectrum, GVFLECLEPYILSDK | 0.000 | 0.000 | 0.000 | 0.105 | 0.365 | 0.000 | 0.530 | 0.000 | ||
| 2 spectra, EHQYDK | 0.000 | 0.012 | 0.032 | 0.000 | 0.260 | 0.261 | 0.434 | 0.000 | ||
| 2 spectra, NQVFEFLIR | 0.000 | 0.416 | 0.000 | 0.000 | 0.338 | 0.000 | 0.246 | 0.000 | ||
| 2 spectra, IVDILLK | 0.065 | 0.131 | 0.058 | 0.000 | 0.478 | 0.000 | 0.268 | 0.000 | ||
| 1 spectrum, TVEEELNK | 0.179 | 0.137 | 0.382 | 0.000 | 0.151 | 0.000 | 0.152 | 0.000 | ||
| 2 spectra, QAVEYQQR | 0.000 | 0.143 | 0.000 | 0.000 | 0.351 | 0.000 | 0.506 | 0.000 | ||
| 2 spectra, DLIVHFQDK | 0.000 | 0.117 | 0.000 | 0.000 | 0.458 | 0.000 | 0.425 | 0.000 | ||
| 1 spectrum, ECTLETEGQTR | 0.000 | 0.000 | 0.000 | 0.153 | 0.304 | 0.000 | 0.543 | 0.000 |
| Plot | Mito | Lyso or Perox | ER | Golgi | PM | Cytosol | Nucleus | ||||||
| Expt B |
2 peptides |
3 spectra |
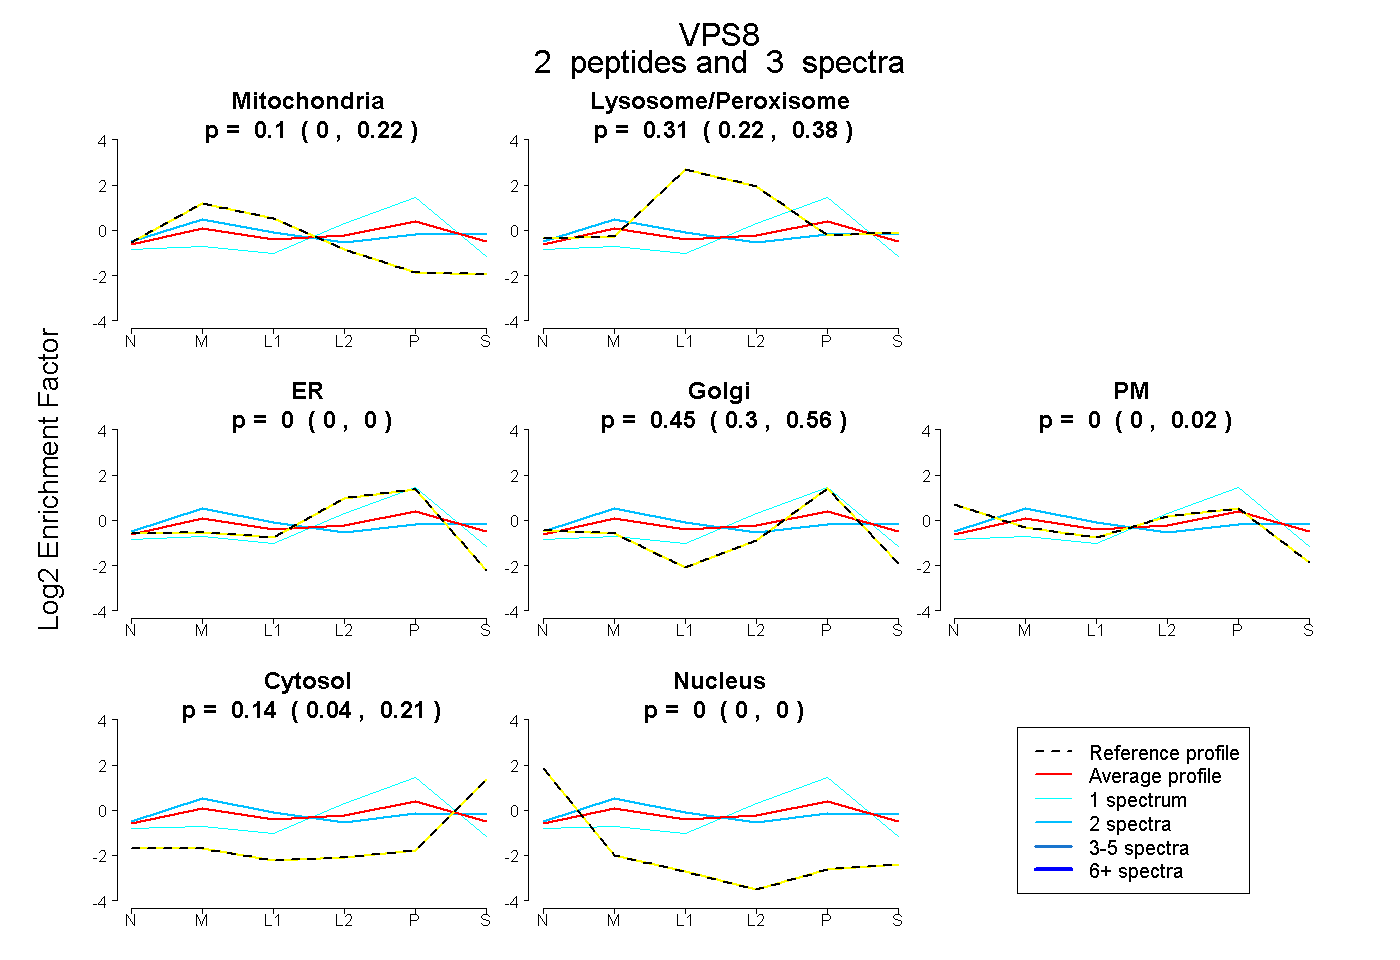 |
0.104 0.000 | 0.219 |
0.311 0.221 | 0.375 |
0.000 0.000 | 0.000 |
0.446 0.302 | 0.560 |
0.000 0.000 | 0.017 |
0.139 0.045 | 0.206 |
0.000 0.000 | 0.000 |
|||
| Plot | Lyso | Other | |||||||||||
| Expt C |
3 peptides |
7 spectra |
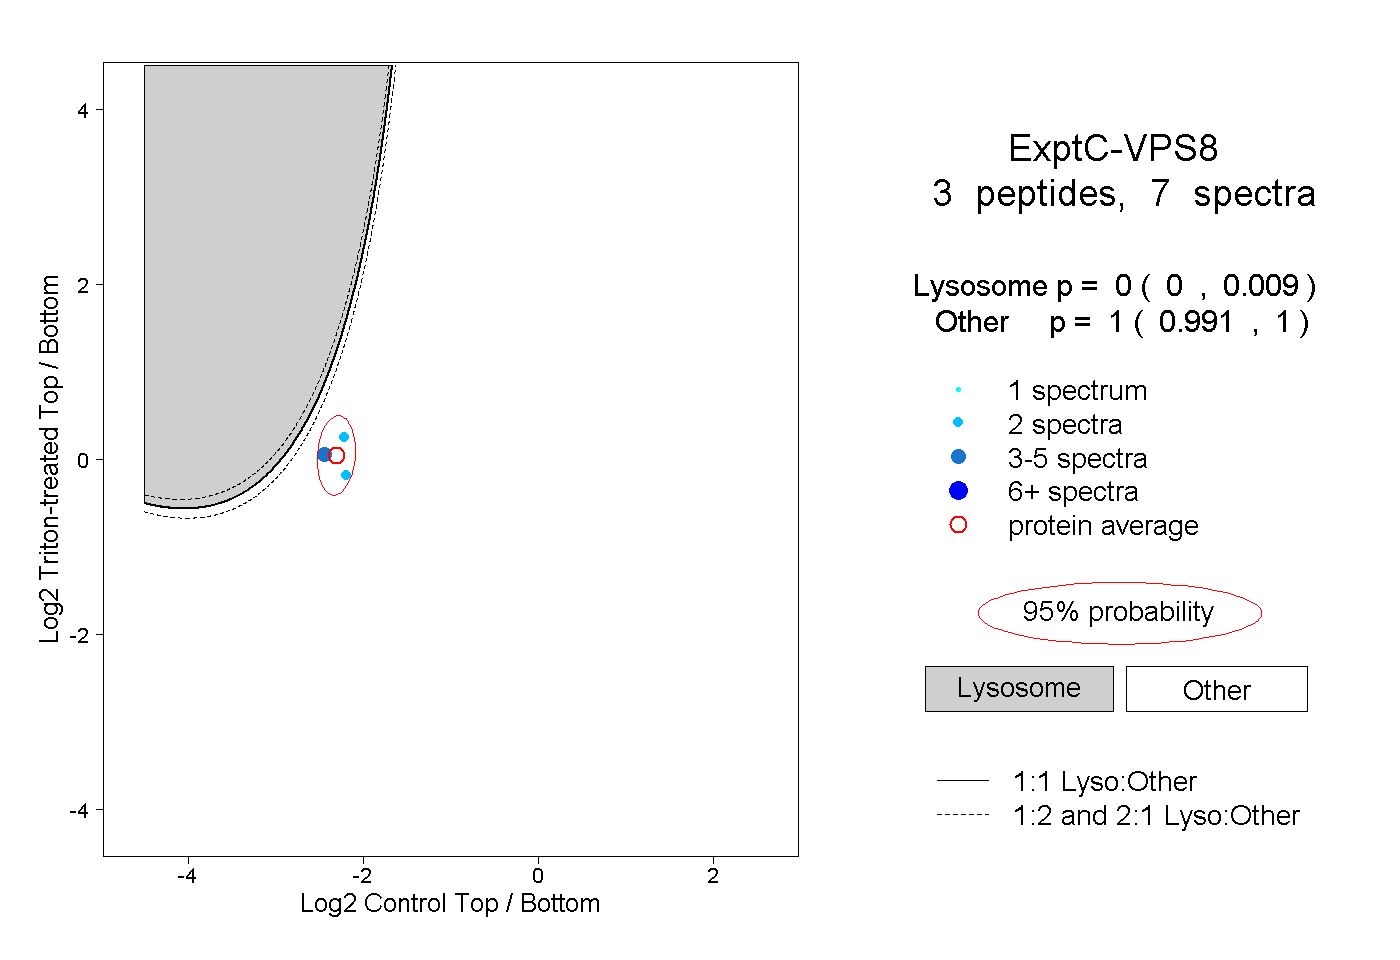 |
0.000 0.000 | 0.009 |
1.000 0.991 | 1.000 |