 8
8peptides
spectra
0.000 | 0.000
0.000 | 0.000
0.100 | 0.157
0.000 | 0.032
0.296 | 0.358
0.000 | 0.012
0.497 | 0.542
0.000 | 0.000
1peptide
spectra
NA | NA
NA | NA
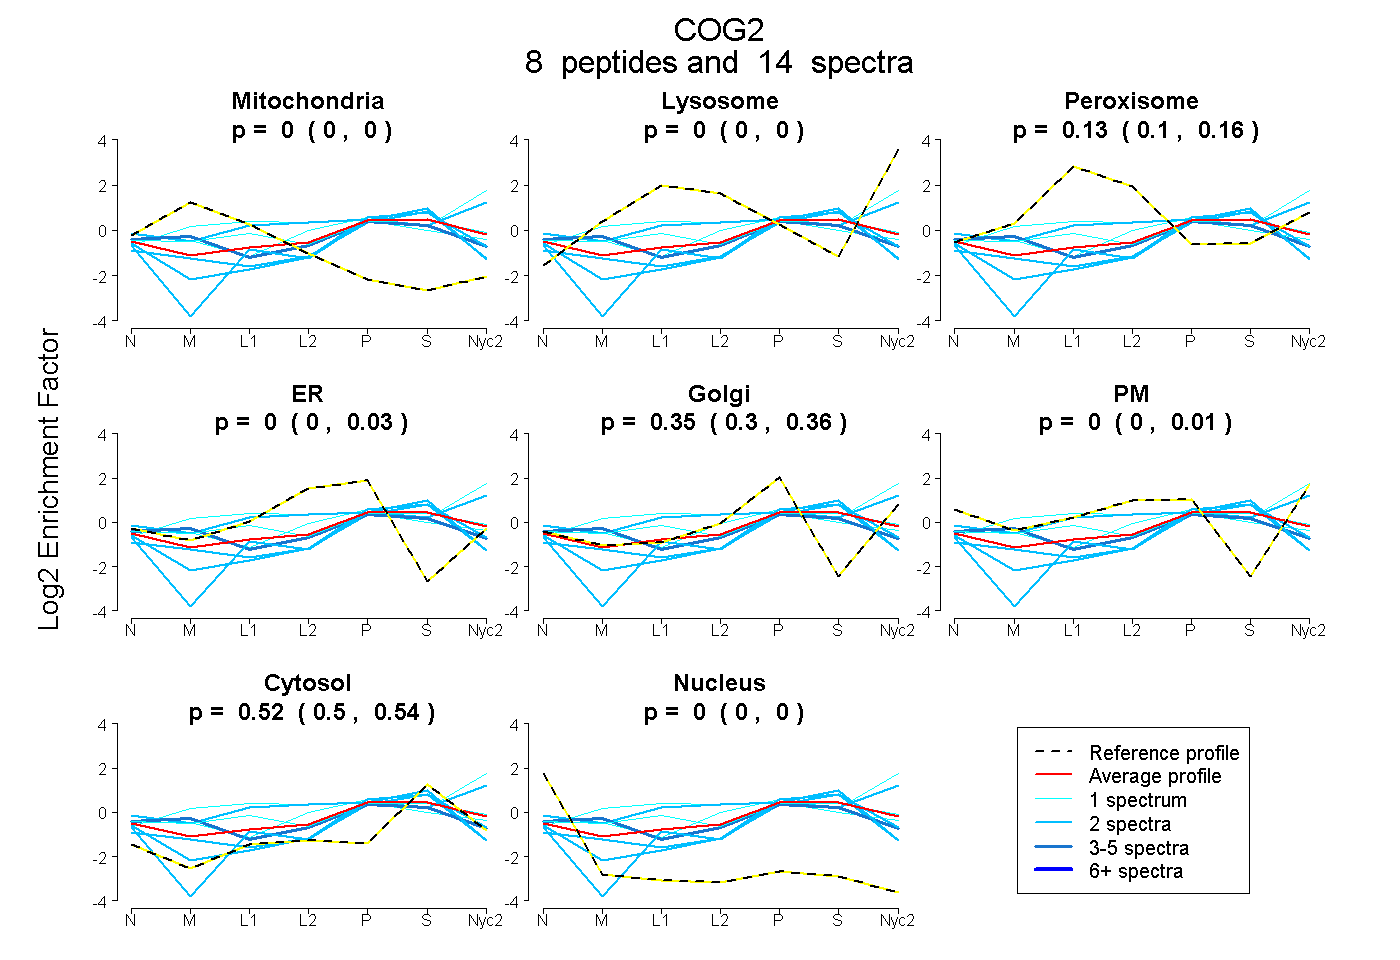
| Plot | Mito | Lyso | Perox | ER | Golgi | PM | Cytosol | Nucleus | |||||
| Expt A |
8 peptides |
14 spectra |
|
0.000 0.000 | 0.000 |
0.000 0.000 | 0.000 |
0.134 0.100 | 0.157 |
0.000 0.000 | 0.032 |
0.345 0.296 | 0.358 |
0.000 0.000 | 0.012 |
0.521 0.497 | 0.542 |
0.000 0.000 | 0.000 |
||
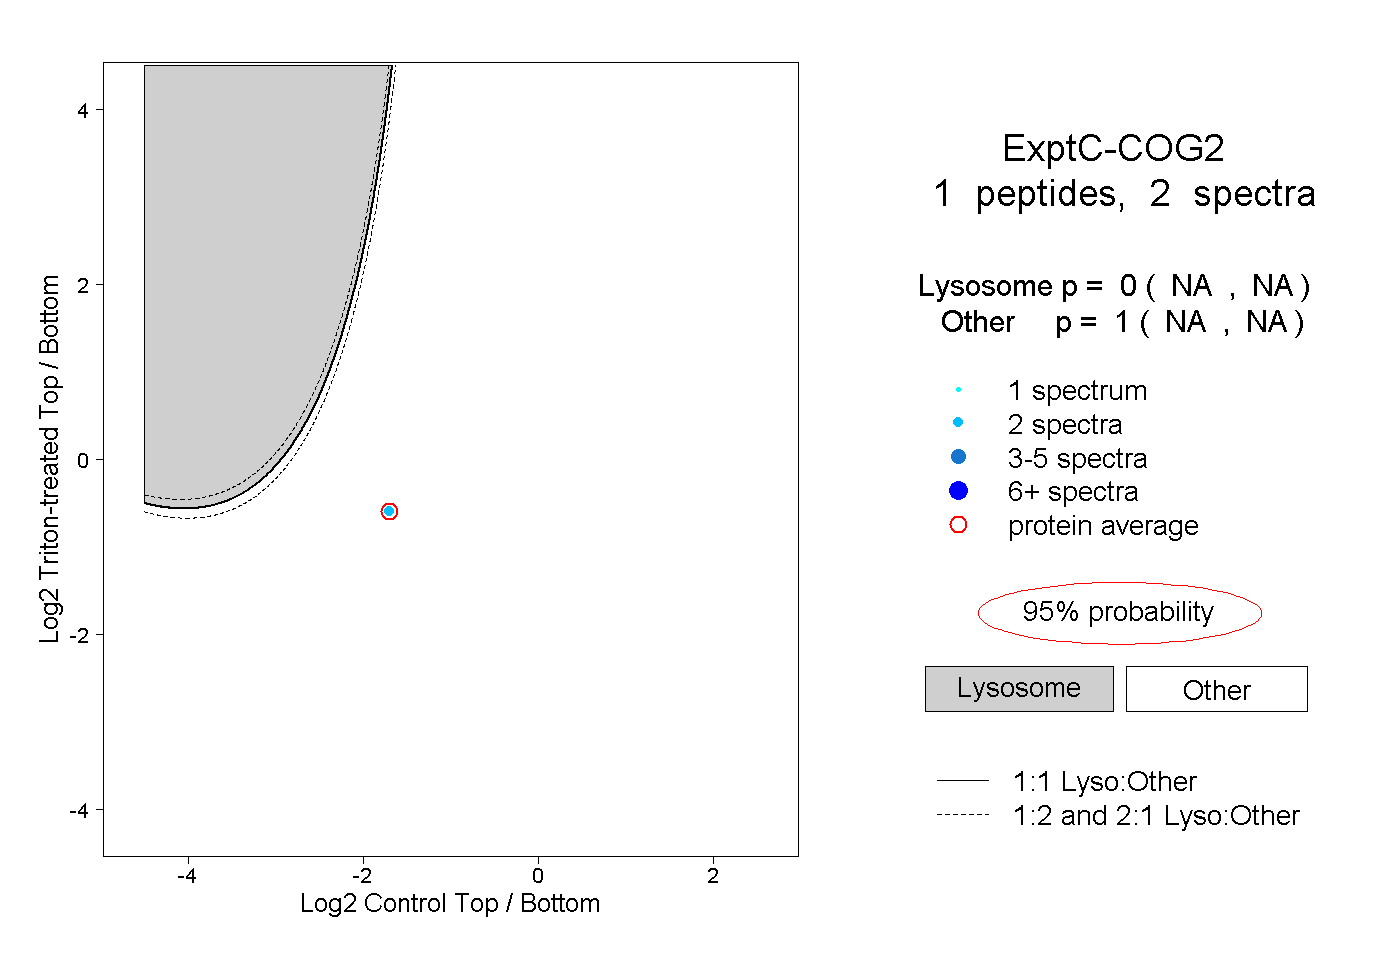
| Plot | Lyso | Other | |||||||||||
| Expt C |
1 peptide |
2 spectra |
|
0.000 NA | NA |
1.000 NA | NA |