 8
8peptides
spectra
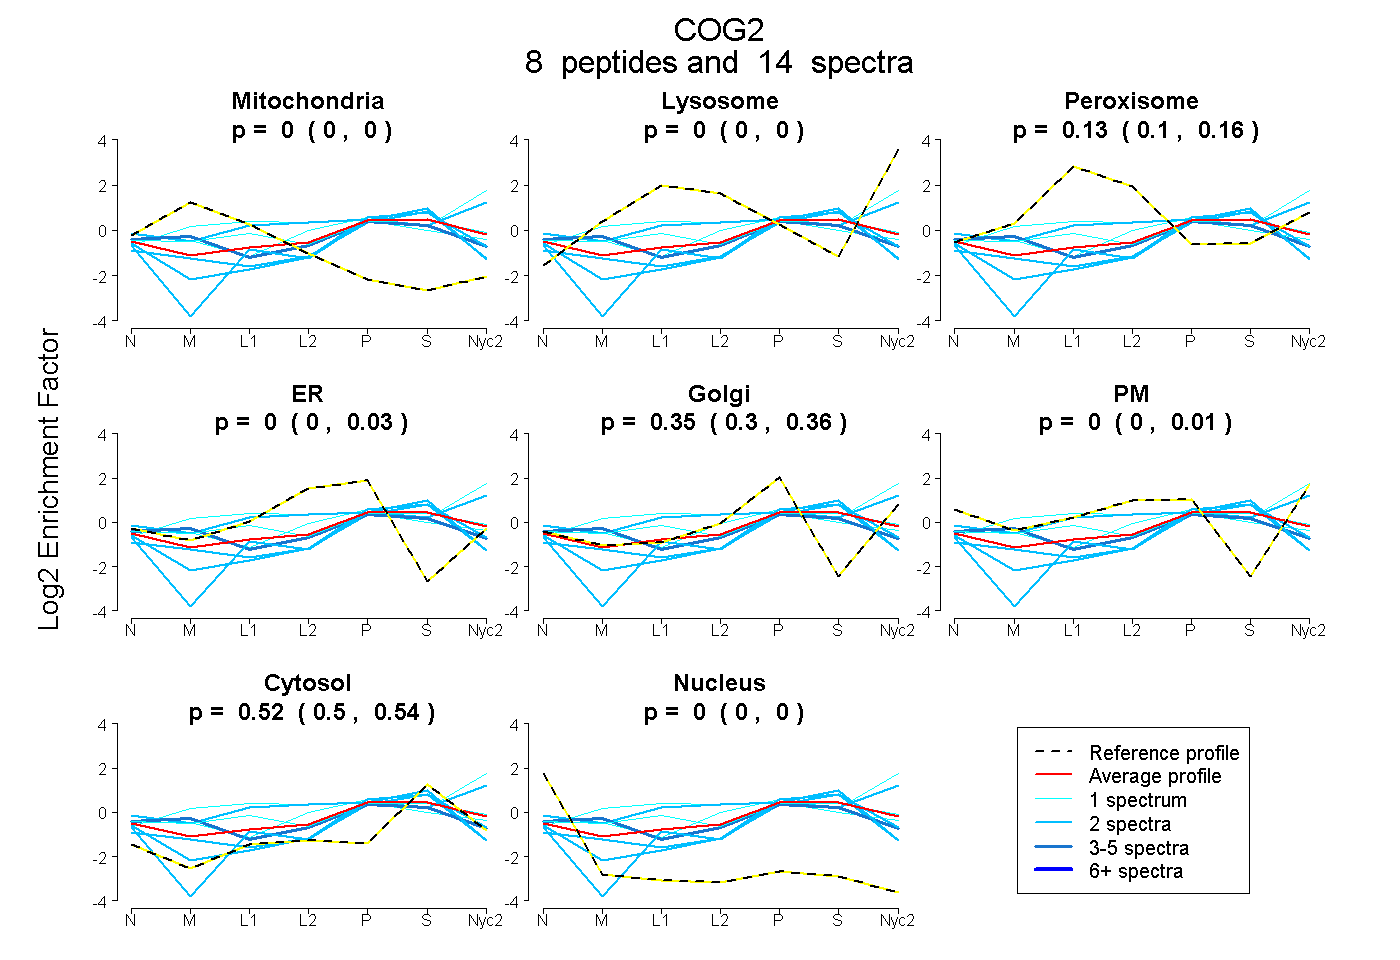
0.000 | 0.000
0.000 | 0.000
0.100 | 0.157
0.000 | 0.032
0.296 | 0.358
0.000 | 0.012
0.497 | 0.542
0.000 | 0.000
| Plot | Mito | Lyso | Perox | ER | Golgi | PM | Cytosol | Nucleus | |||||
| Expt A |
8 peptides |
14 spectra |
|
0.000 0.000 | 0.000 |
0.000 0.000 | 0.000 |
0.134 0.100 | 0.157 |
0.000 0.000 | 0.032 |
0.345 0.296 | 0.358 |
0.000 0.000 | 0.012 |
0.521 0.497 | 0.542 |
0.000 0.000 | 0.000 |
| 2 spectra, EVTGGAVSSEK | 0.000 | 0.200 | 0.114 | 0.000 | 0.000 | 0.339 | 0.348 | 0.000 | ||
| 1 spectrum, DASSQEASSPLLTGQVLER | 0.085 | 0.000 | 0.375 | 0.119 | 0.151 | 0.000 | 0.270 | 0.000 | ||
| 1 spectrum, AHPAYHSFSNK | 0.000 | 0.188 | 0.000 | 0.000 | 0.128 | 0.314 | 0.371 | 0.000 | ||
| 2 spectra, SFPALTELVLAAR | 0.000 | 0.000 | 0.000 | 0.095 | 0.074 | 0.000 | 0.814 | 0.017 | ||
| 3 spectra, LLEFVPHHCR | 0.161 | 0.000 | 0.030 | 0.009 | 0.349 | 0.000 | 0.452 | 0.000 | ||
| 2 spectra, VQPAVMQR | 0.000 | 0.000 | 0.000 | 0.000 | 0.301 | 0.000 | 0.698 | 0.001 | ||
| 2 spectra, GMPLLDK | 0.040 | 0.000 | 0.000 | 0.021 | 0.239 | 0.000 | 0.700 | 0.000 | ||
| 1 spectrum, QCGSQASVK | 0.028 | 0.000 | 0.249 | 0.000 | 0.291 | 0.000 | 0.432 | 0.000 |
| Plot | Lyso | Other | |||||||||||
| Expt C |
1 peptide |
2 spectra |
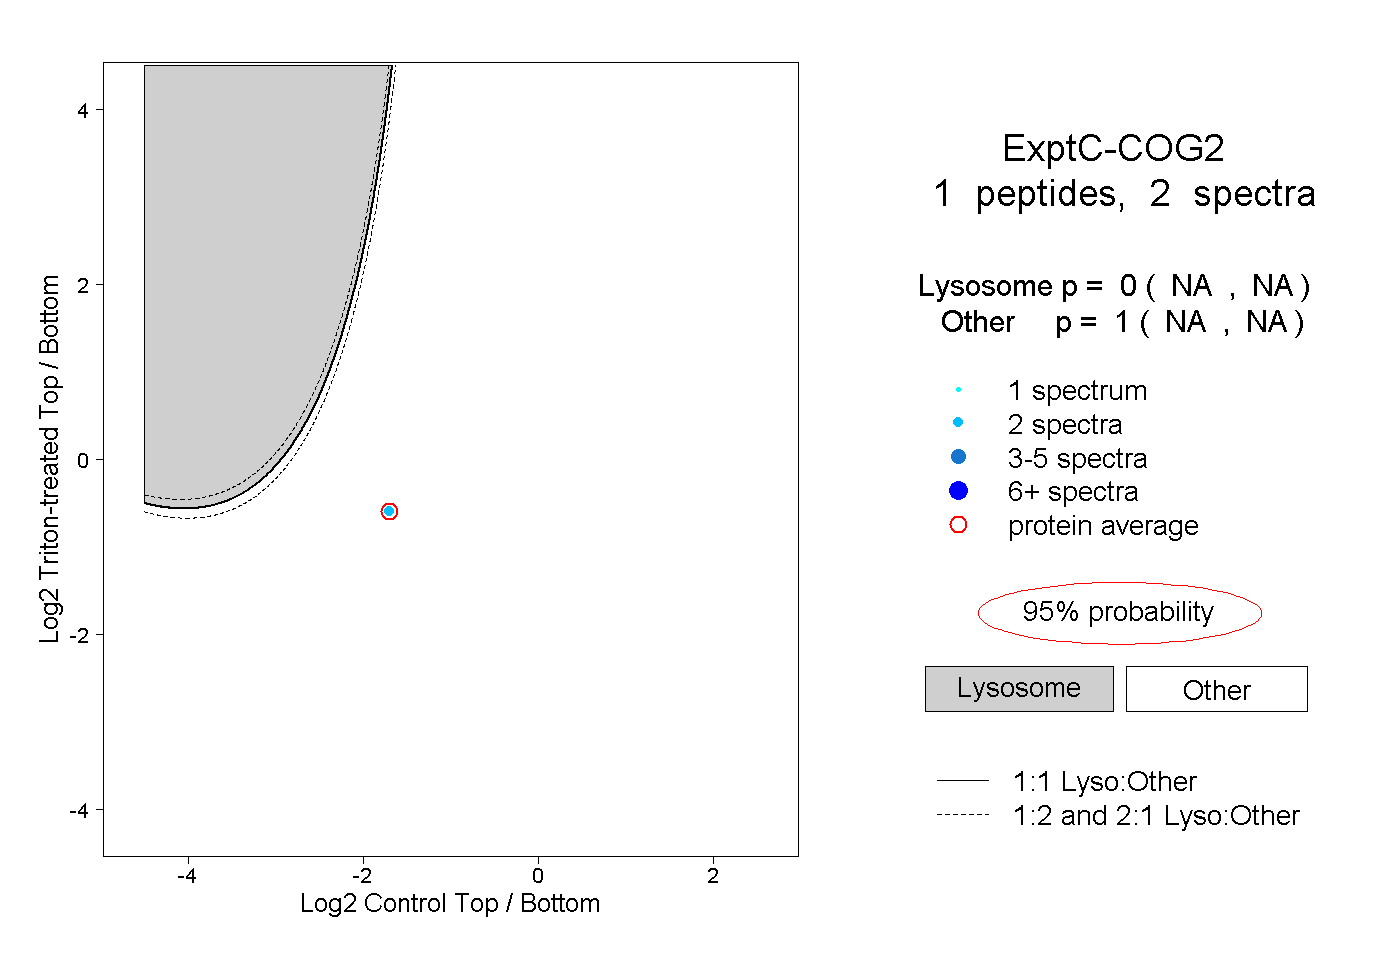 |
0.000 NA | NA |
1.000 NA | NA |