 6
6peptides
spectra
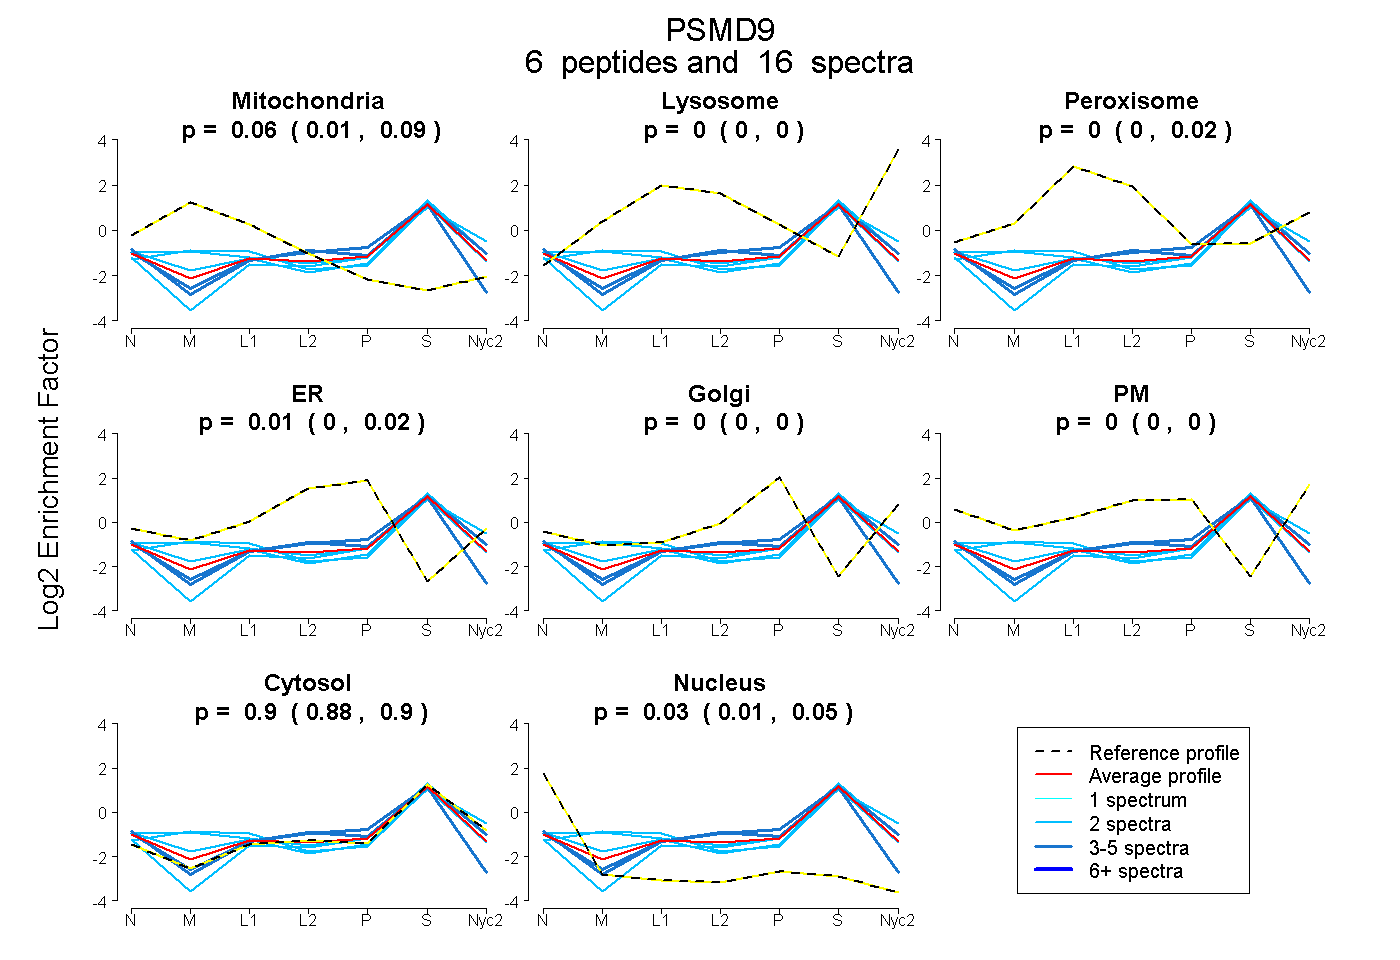
0.014 | 0.095
0.000 | 0.000
0.000 | 0.019
0.000 | 0.022
0.000 | 0.000
0.000 | 0.000
0.882 | 0.904
0.010 | 0.052
5peptides
spectra
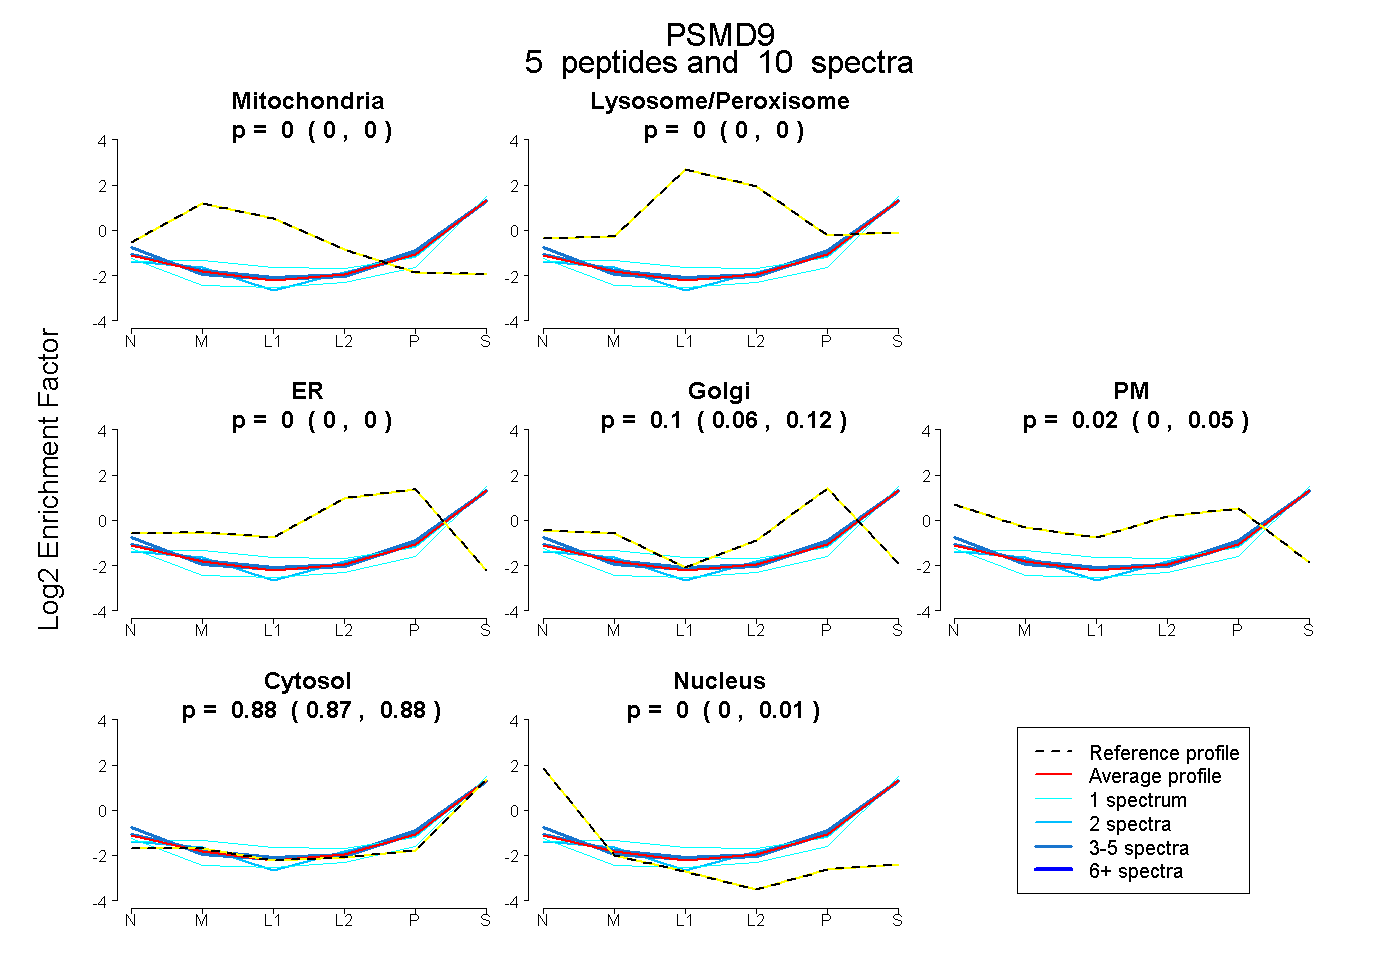
0.000 | 0.000
0.000 | 0.000
0.000 | 0.000
0.059 | 0.122
0.000 | 0.054
0.865 | 0.885
0.000 | 0.014
5peptides
spectra
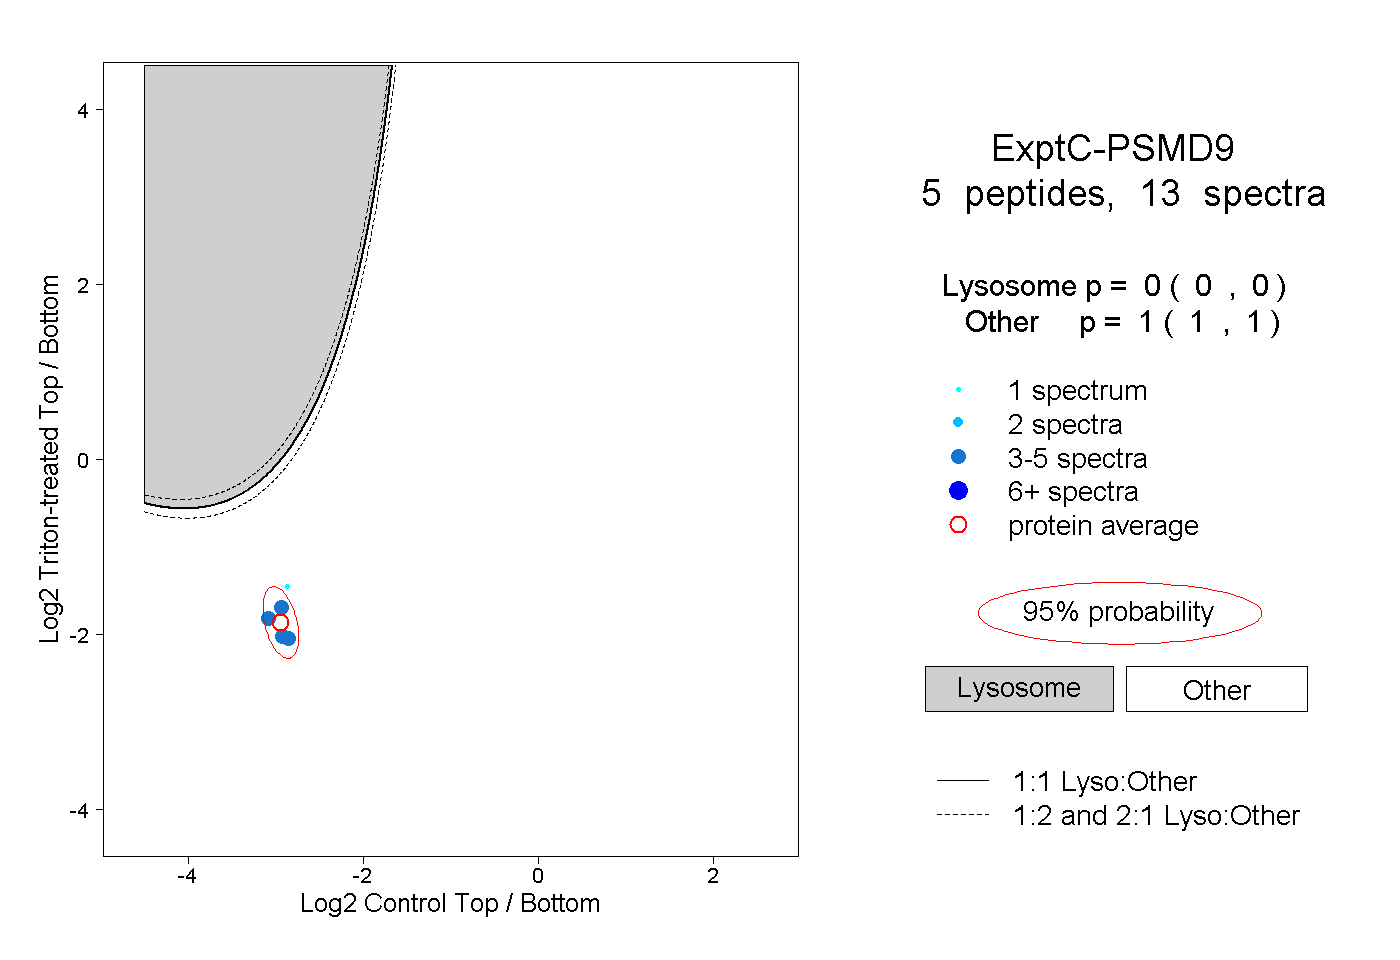
0.000 | 0.000
1.000 | 1.000