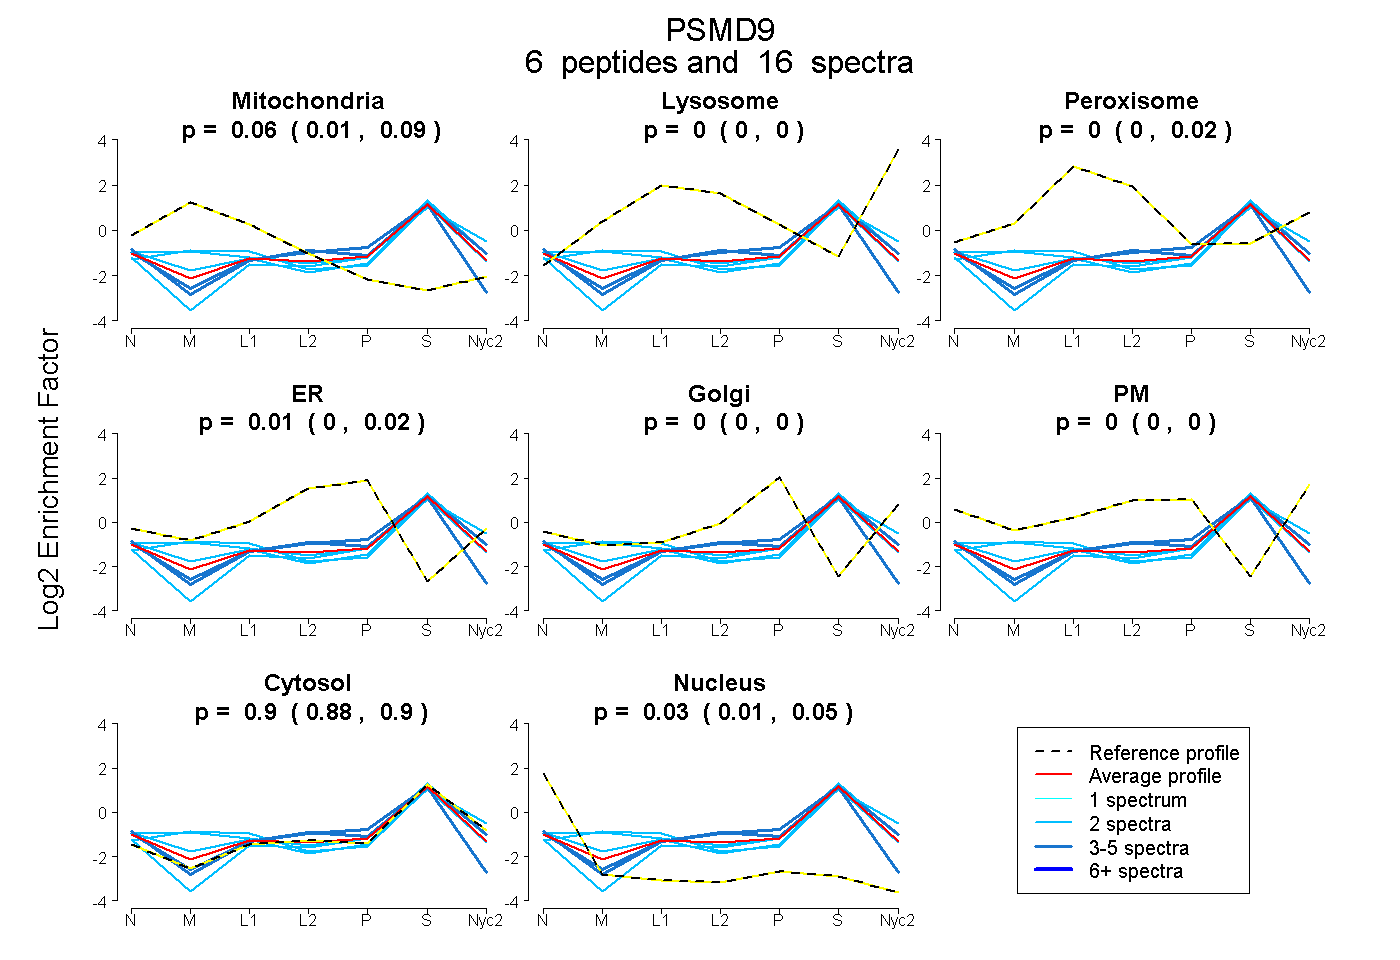
 6
6peptides
spectra
0.014 | 0.095
0.000 | 0.000
0.000 | 0.019
0.000 | 0.022
0.000 | 0.000
0.000 | 0.000
0.882 | 0.904
0.010 | 0.052
| Plot | Mito | Lyso | Perox | ER | Golgi | PM | Cytosol | Nucleus | |||||
| Expt A |
6 peptides |
16 spectra |
|
0.064 0.014 | 0.095 |
0.000 0.000 | 0.000 |
0.000 0.000 | 0.019 |
0.010 0.000 | 0.022 |
0.000 0.000 | 0.000 |
0.000 0.000 | 0.000 |
0.897 0.882 | 0.904 |
0.029 0.010 | 0.052 |
| 5 spectra, HNIICLQNDHK | 0.000 | 0.000 | 0.000 | 0.095 | 0.000 | 0.000 | 0.901 | 0.004 | ||
| 2 spectra, ANYDVLESQK | 0.106 | 0.000 | 0.000 | 0.000 | 0.000 | 0.000 | 0.871 | 0.024 | ||
| 2 spectra, ADVDLYQVR | 0.000 | 0.000 | 0.000 | 0.000 | 0.000 | 0.000 | 0.959 | 0.041 | ||
| 3 spectra, QVEEALHQLHAR | 0.000 | 0.000 | 0.000 | 0.021 | 0.000 | 0.000 | 0.831 | 0.148 | ||
| 2 spectra, LASDSPALPK | 0.167 | 0.068 | 0.000 | 0.000 | 0.000 | 0.000 | 0.765 | 0.000 | ||
| 2 spectra, AAAVSDIQELMR | 0.239 | 0.000 | 0.000 | 0.000 | 0.000 | 0.000 | 0.761 | 0.000 |
| Plot | Mito | Lyso or Perox | ER | Golgi | PM | Cytosol | Nucleus | ||||||
| Expt B |
5 peptides |
10 spectra |
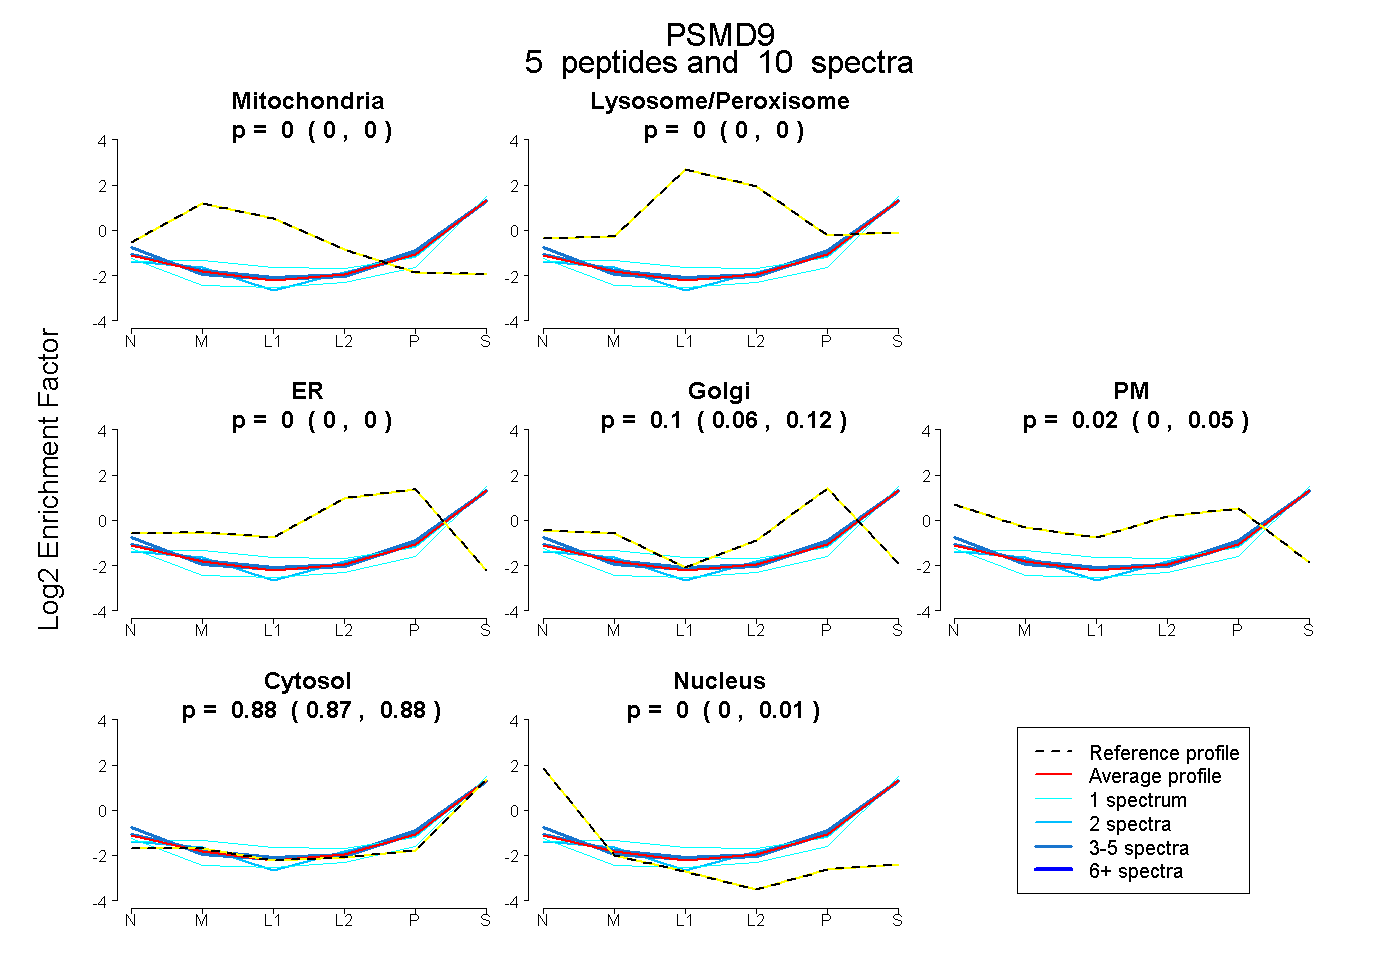 |
0.000 0.000 | 0.000 |
0.000 0.000 | 0.000 |
0.000 0.000 | 0.000 |
0.098 0.059 | 0.122 |
0.024 0.000 | 0.054 |
0.876 0.865 | 0.885 |
0.002 0.000 | 0.014 |
|||
| Plot | Lyso | Other | |||||||||||
| Expt C |
5 peptides |
13 spectra |
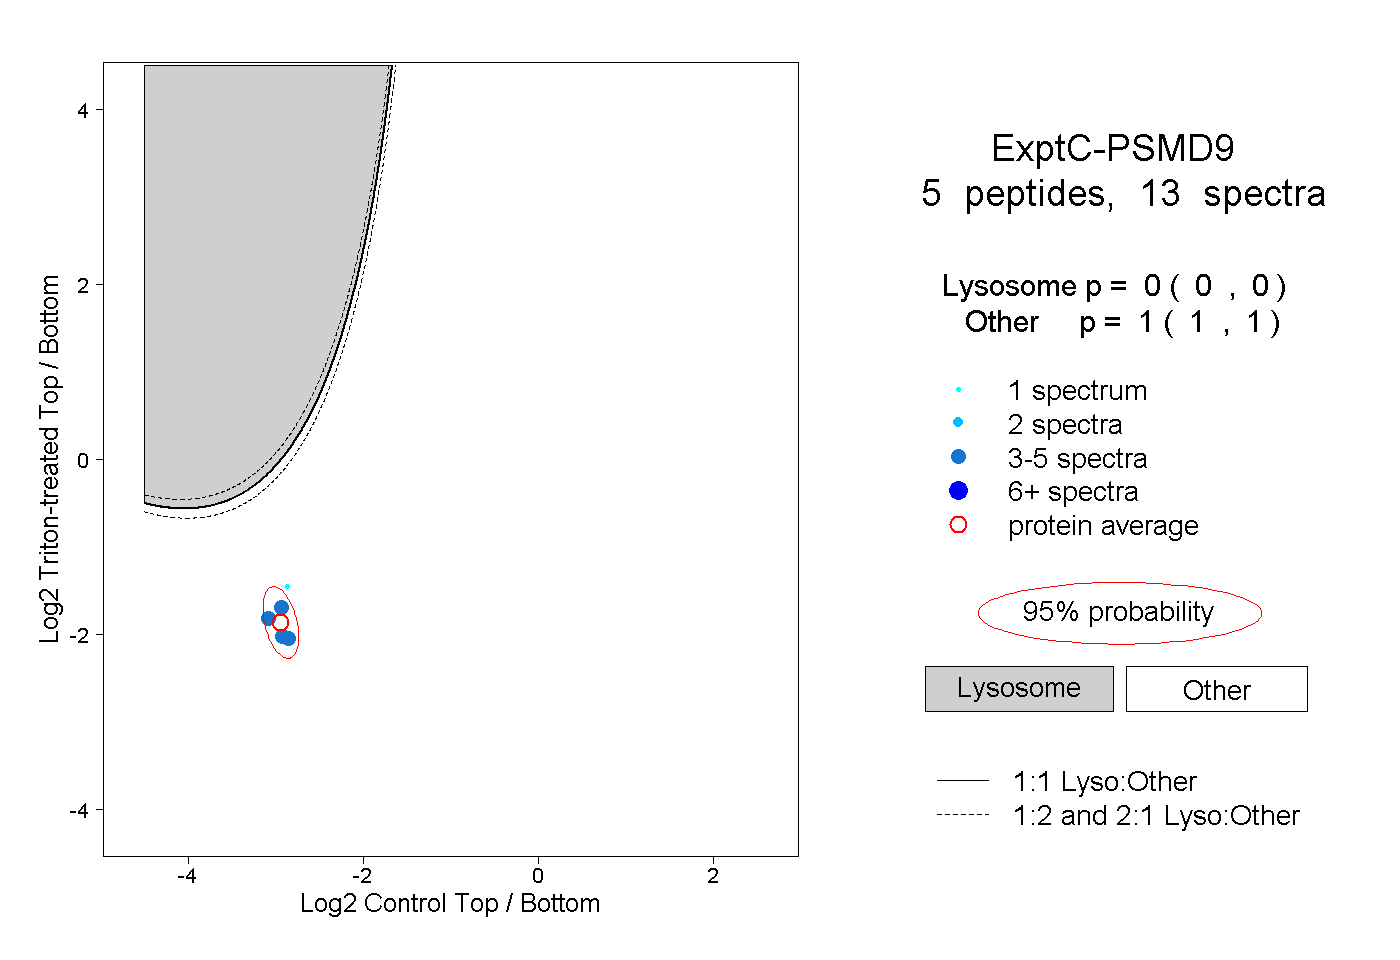 |
0.000 0.000 | 0.000 |
1.000 1.000 | 1.000 |