 7
7peptides
spectra
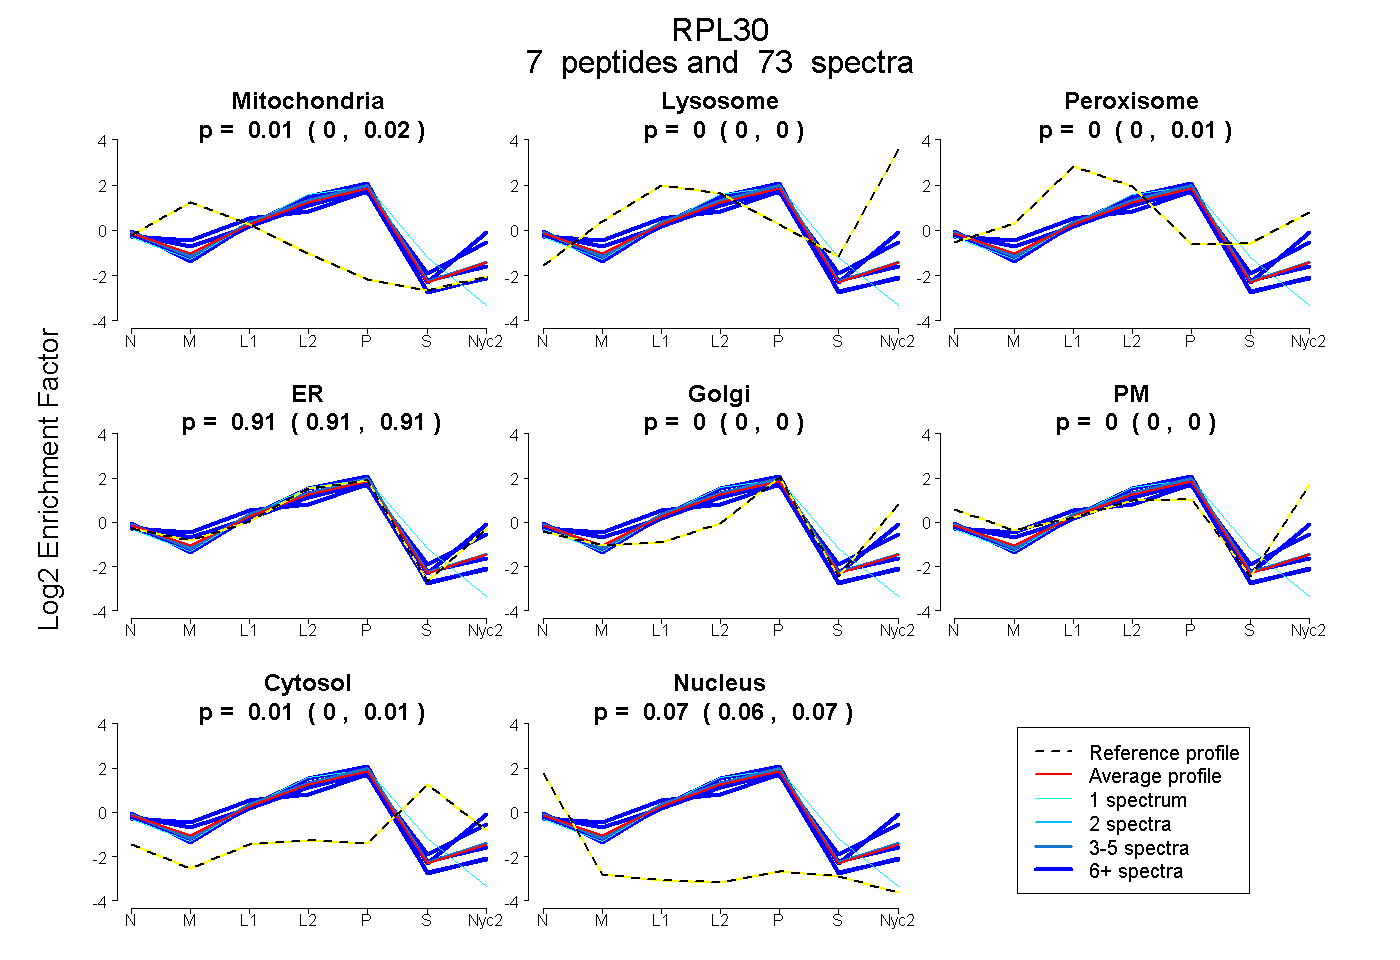
0.000 | 0.016
0.000 | 0.000
0.000 | 0.011
0.905 | 0.914
0.000 | 0.000
0.000 | 0.000
0.002 | 0.013
0.064 | 0.074
6peptides
spectra
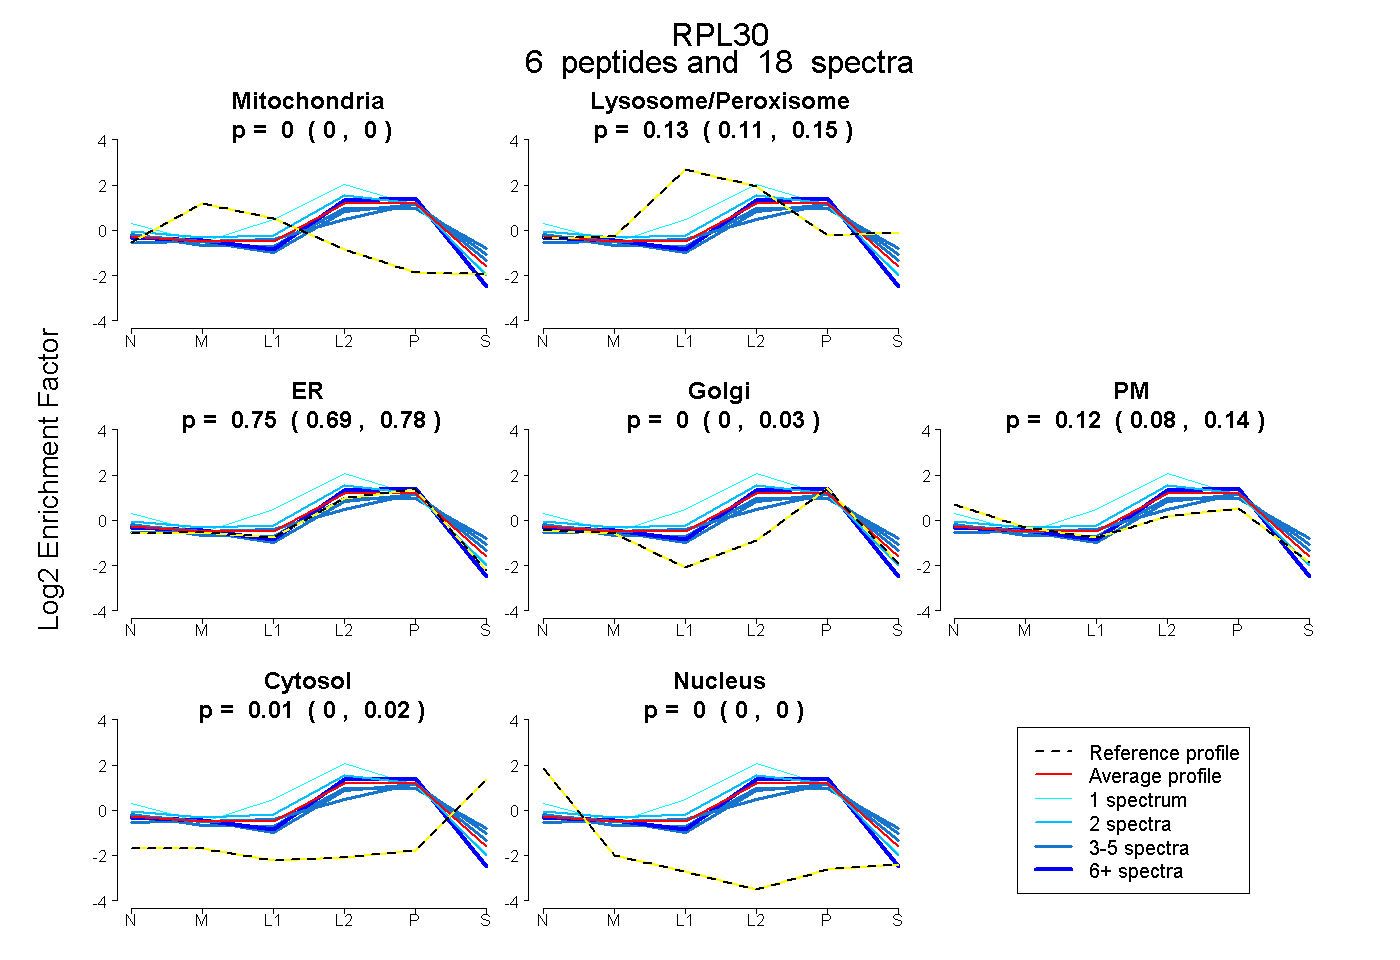
0.000 | 0.000
0.108 | 0.151
0.688 | 0.776
0.000 | 0.028
0.081 | 0.140
0.000 | 0.020
0.000 | 0.000
7peptides
spectra
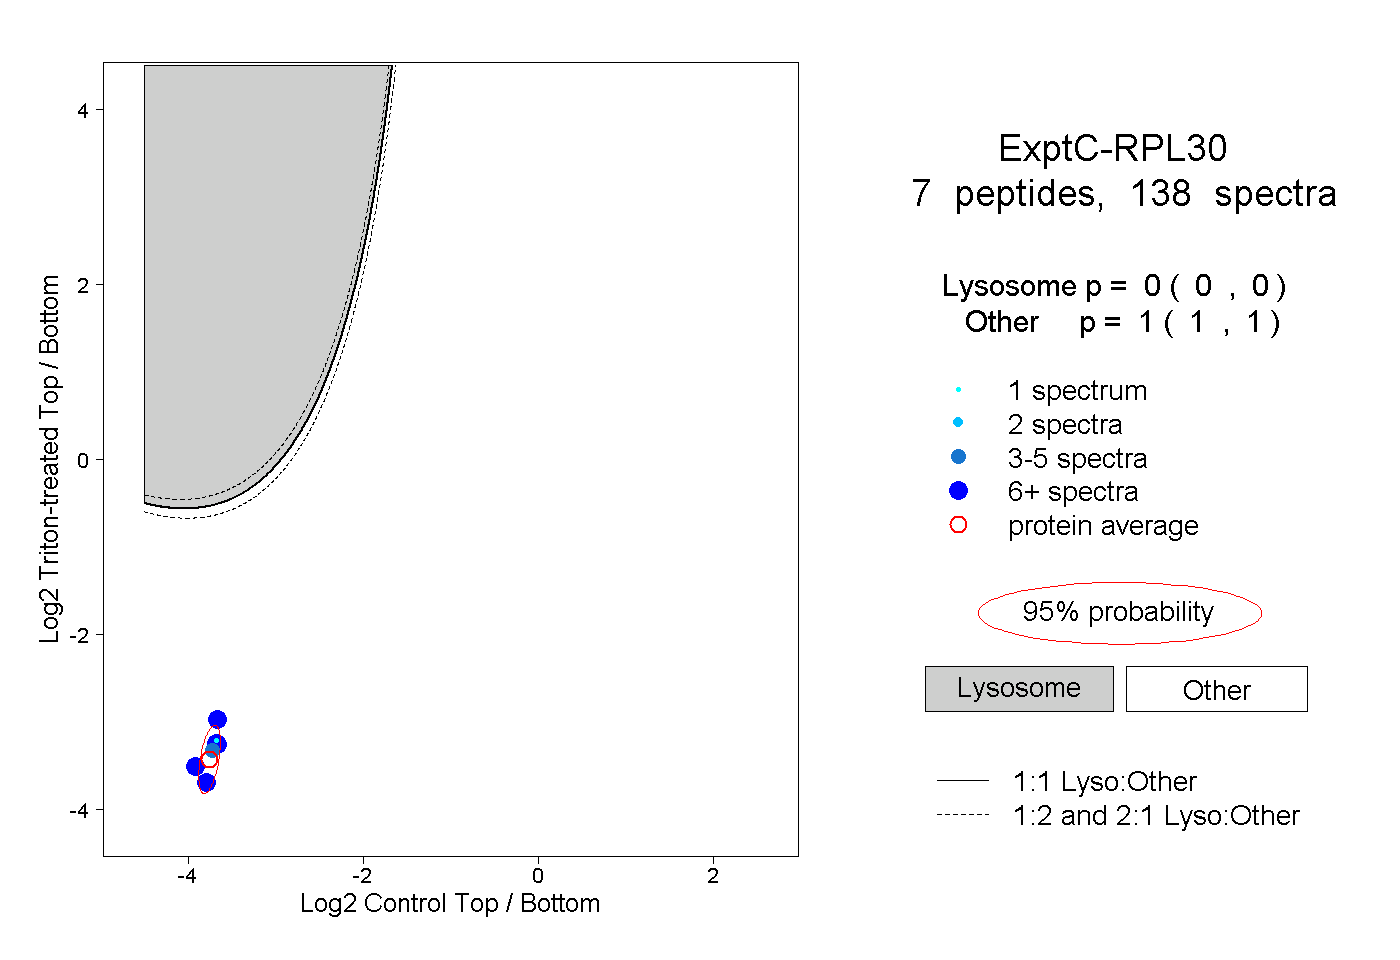
0.000 | 0.000
1.000 | 1.000
4peptides
spectra
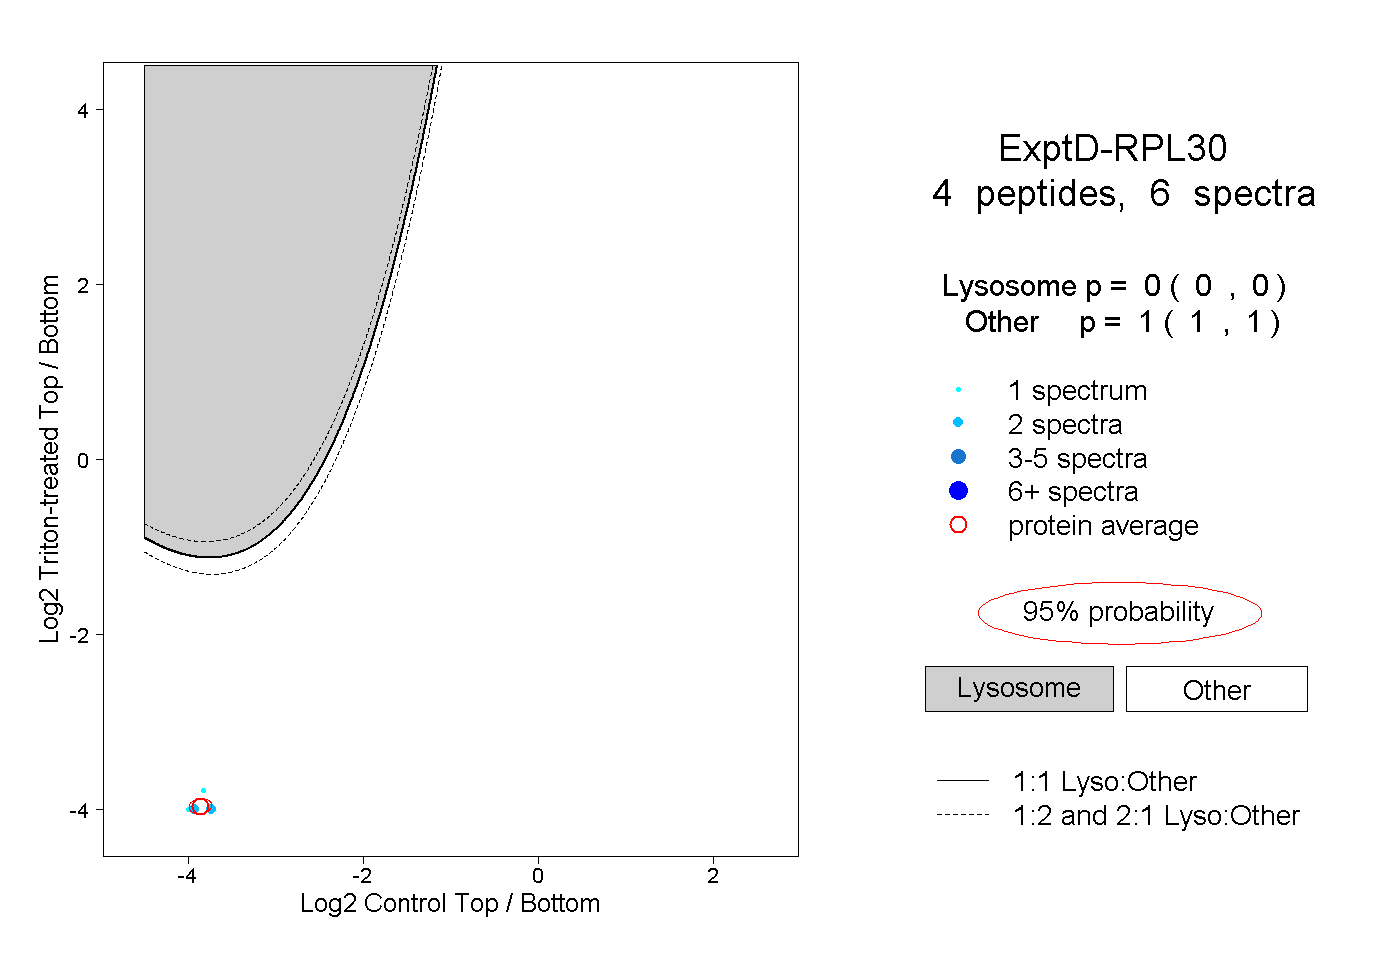
0.000 | 0.000
1.000 | 1.000