 7
7peptides
spectra
0.000 | 0.016
0.000 | 0.000
0.000 | 0.011
0.905 | 0.914
0.000 | 0.000
0.000 | 0.000
0.002 | 0.013
0.064 | 0.074
| Plot | Mito | Lyso | Perox | ER | Golgi | PM | Cytosol | Nucleus | |||||
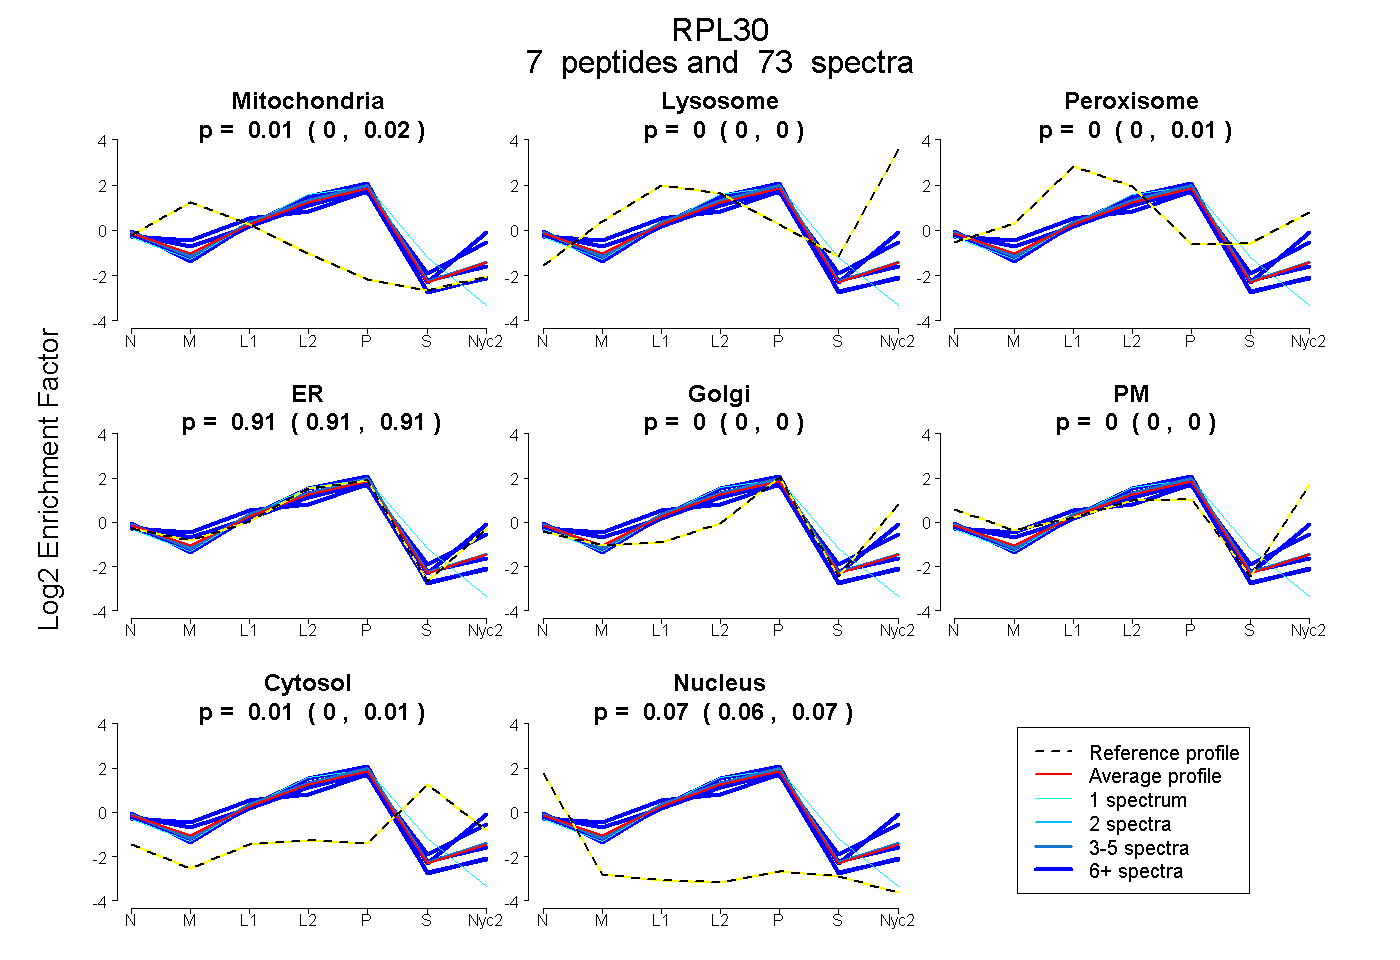
| Expt A |
7 peptides |
73 spectra |
|
0.008 0.000 | 0.016 |
0.000 0.000 | 0.000 |
0.004 0.000 | 0.011 |
0.910 0.905 | 0.914 |
0.000 0.000 | 0.000 |
0.000 0.000 | 0.000 |
0.008 0.002 | 0.013 |
0.070 0.064 | 0.074 |
| 4 spectra, YVLGYK | 0.000 | 0.000 | 0.000 | 0.928 | 0.000 | 0.000 | 0.012 | 0.060 | ||
| 7 spectra, SEIEYYAMLAK | 0.182 | 0.000 | 0.000 | 0.782 | 0.000 | 0.000 | 0.000 | 0.036 | ||
| 1 spectrum, VCTLAIIDPGDSDIIR | 0.000 | 0.000 | 0.000 | 0.798 | 0.000 | 0.000 | 0.124 | 0.078 | ||
| 10 spectra, SLESINSR | 0.000 | 0.000 | 0.039 | 0.846 | 0.071 | 0.015 | 0.029 | 0.000 | ||
| 15 spectra, LVILANNCPALR | 0.000 | 0.000 | 0.000 | 0.908 | 0.000 | 0.000 | 0.000 | 0.092 | ||
| 18 spectra, SMPEQTGEK | 0.000 | 0.000 | 0.000 | 0.881 | 0.000 | 0.000 | 0.029 | 0.090 | ||
| 18 spectra, LQLVMK | 0.012 | 0.000 | 0.060 | 0.844 | 0.000 | 0.000 | 0.084 | 0.000 |
| Plot | Mito | Lyso or Perox | ER | Golgi | PM | Cytosol | Nucleus | ||||||
| Expt B |
6 peptides |
18 spectra |
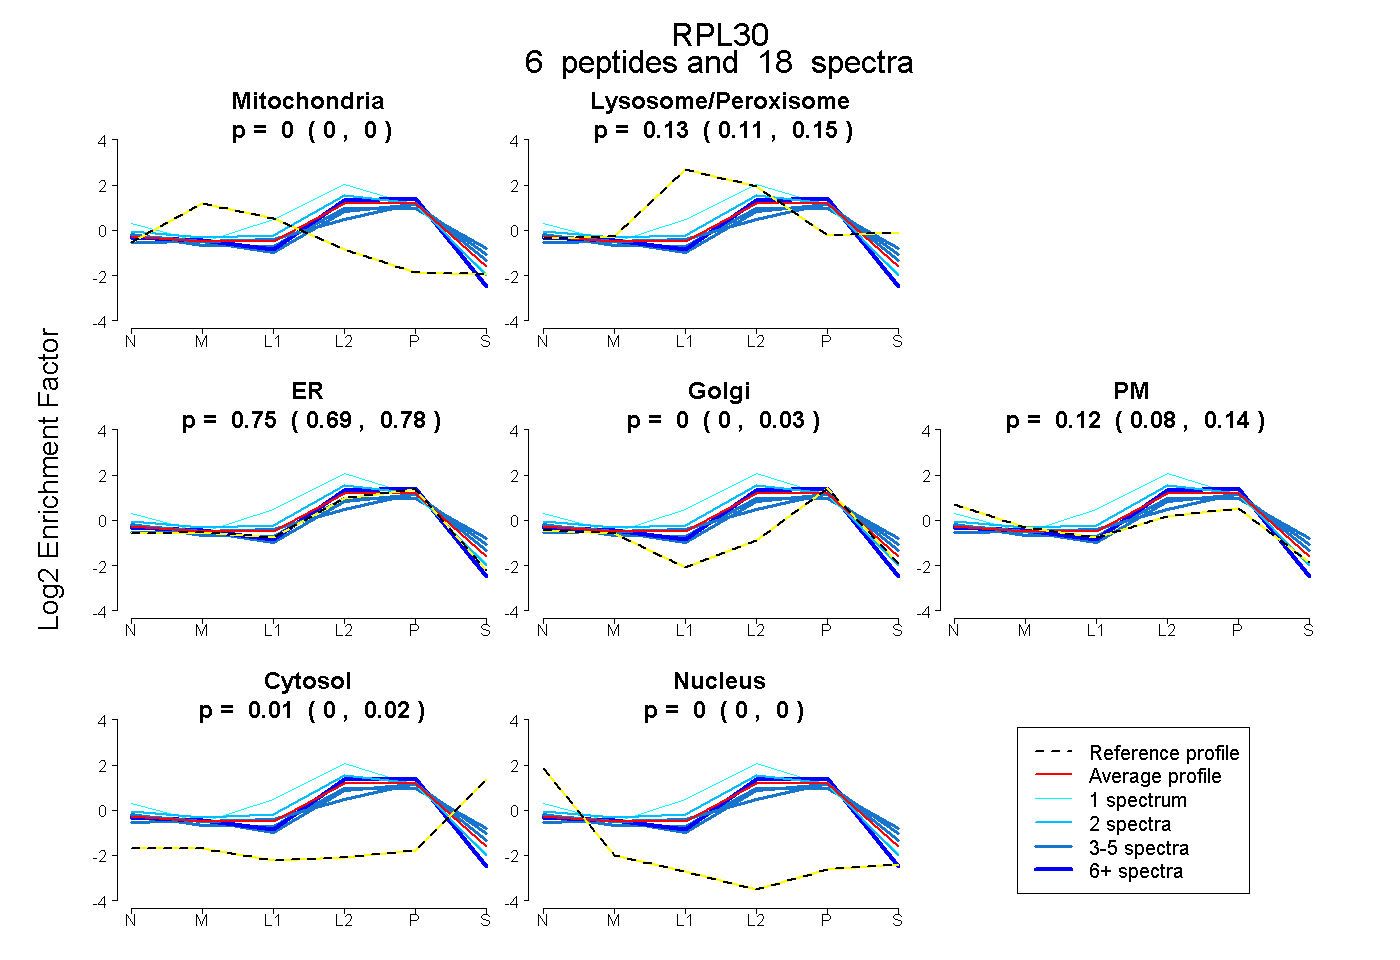 |
0.000 0.000 | 0.000 |
0.130 0.108 | 0.151 |
0.746 0.688 | 0.776 |
0.000 0.000 | 0.028 |
0.116 0.081 | 0.140 |
0.007 0.000 | 0.020 |
0.000 0.000 | 0.000 |
|||
| Plot | Lyso | Other | |||||||||||
| Expt C |
7 peptides |
138 spectra |
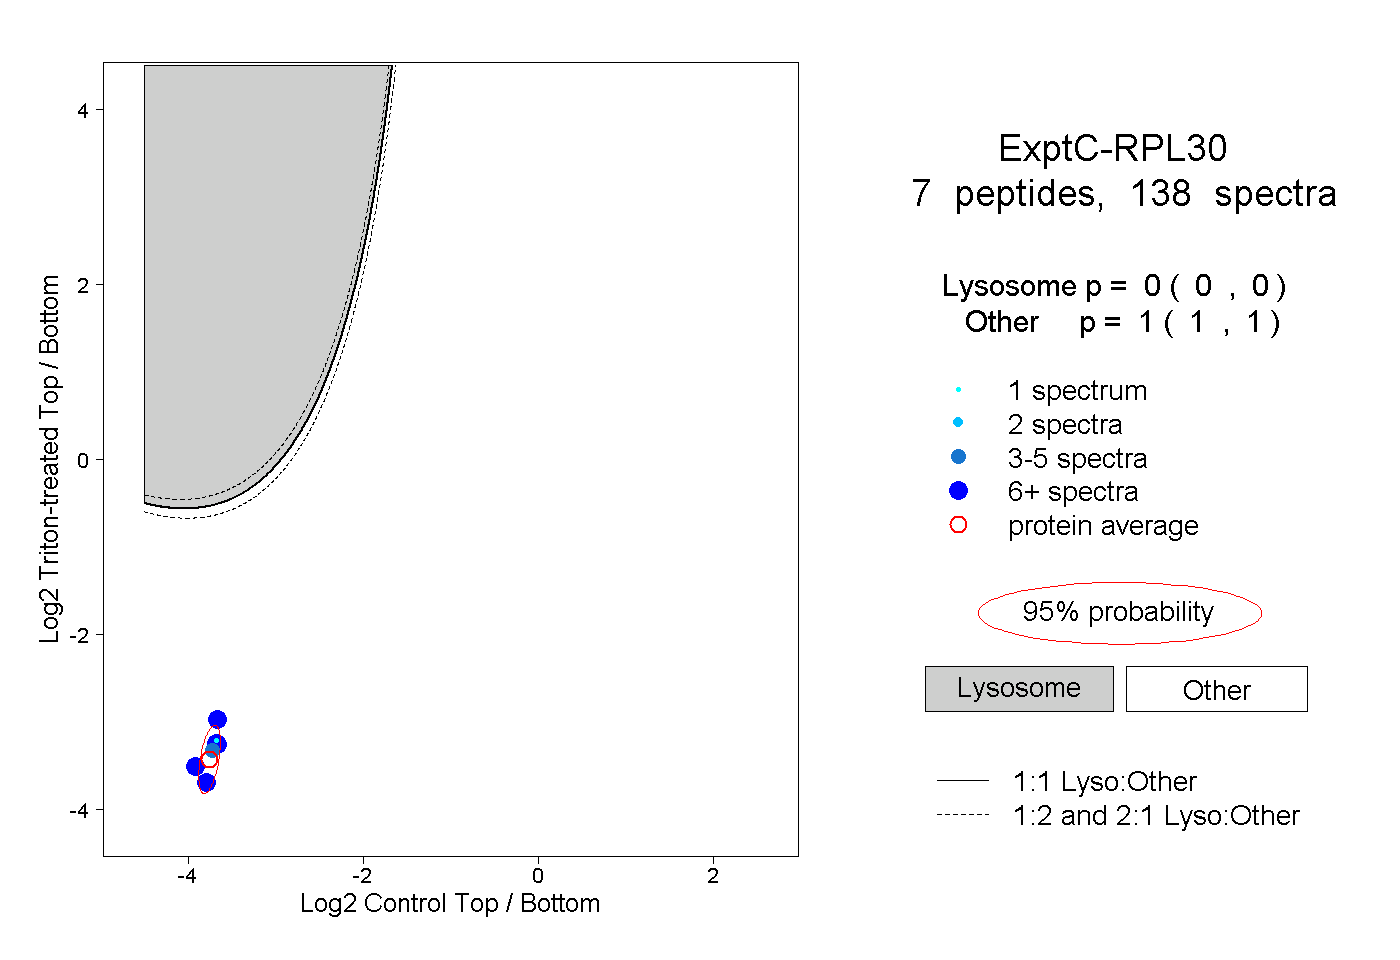 |
0.000 0.000 | 0.000 |
1.000 1.000 | 1.000 |
||||||||
| Plot | Lyso | Other | |||||||||||
| Expt D |
4 peptides |
6 spectra |
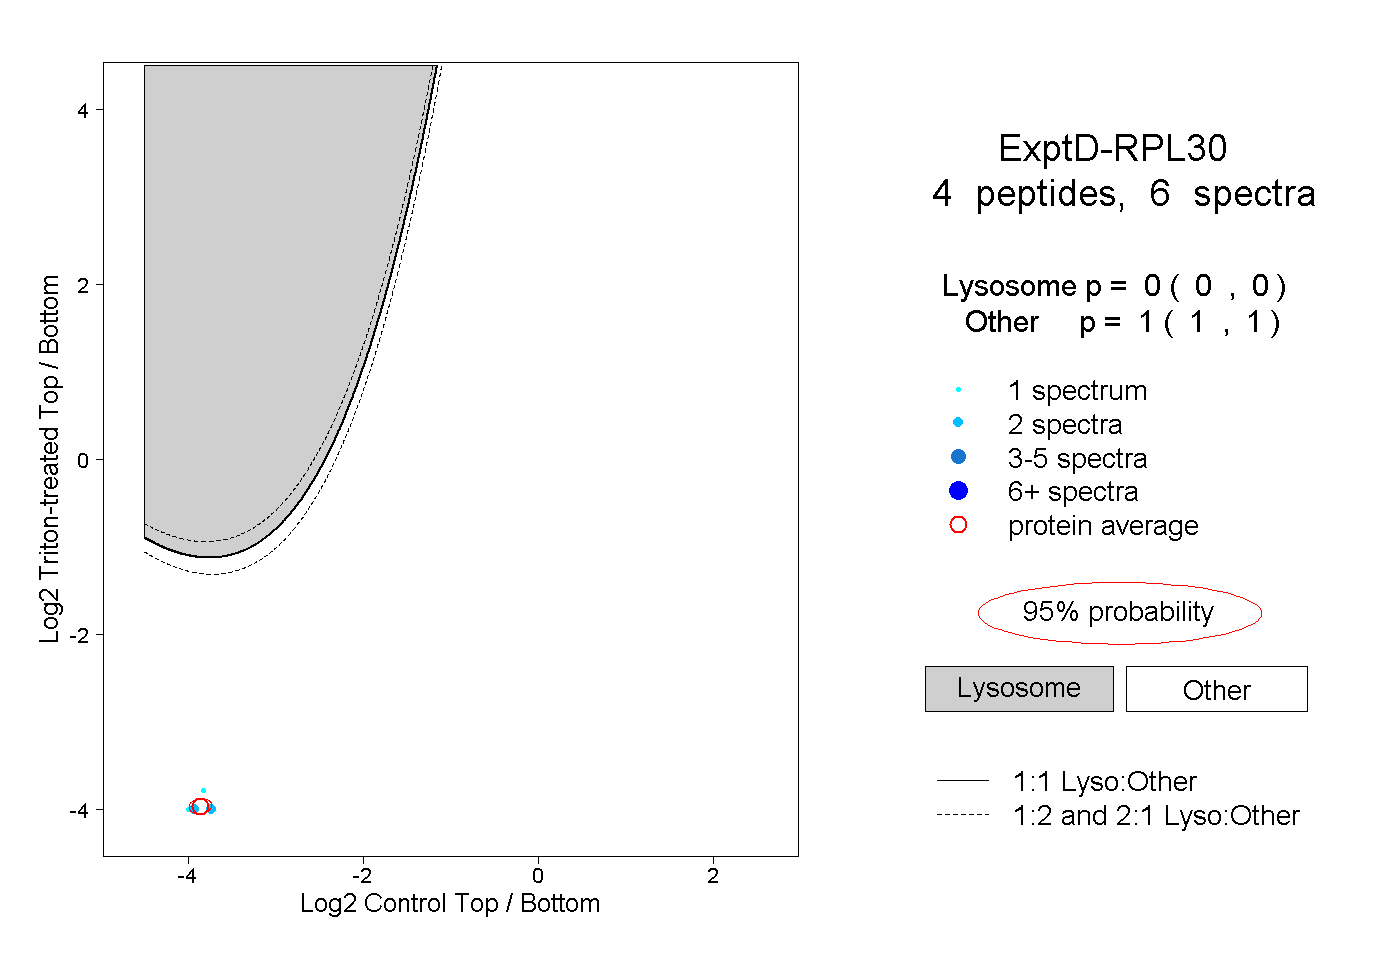 |
0.000 0.000 | 0.000 |
1.000 1.000 | 1.000 |