 8
8peptides
spectra
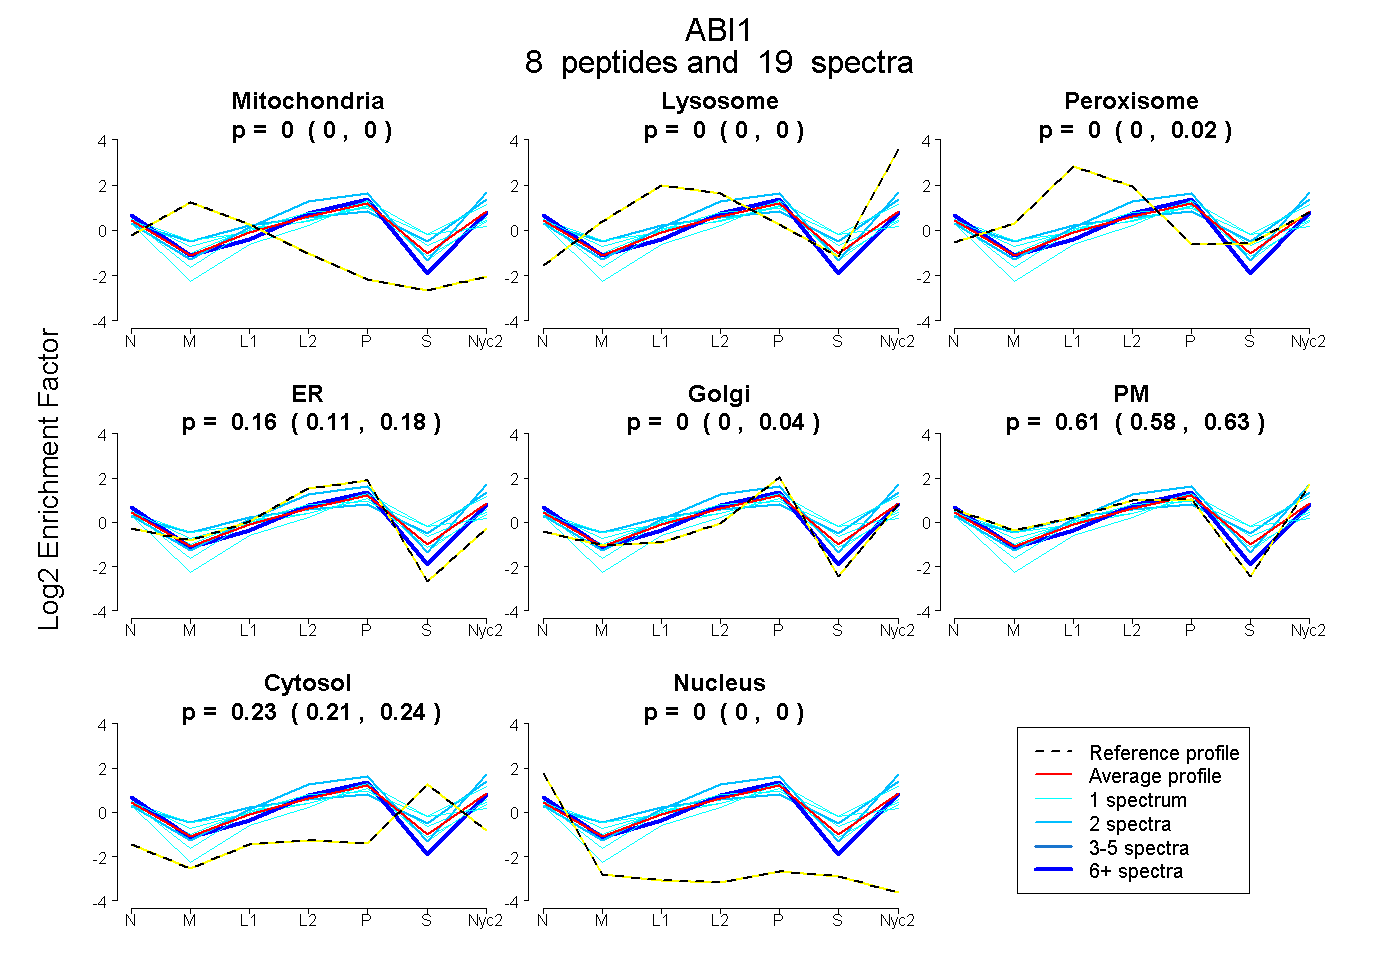
0.000 | 0.000
0.000 | 0.000
0.000 | 0.018
0.111 | 0.185
0.000 | 0.037
0.575 | 0.633
0.209 | 0.236
0.000 | 0.000
3peptides
spectra
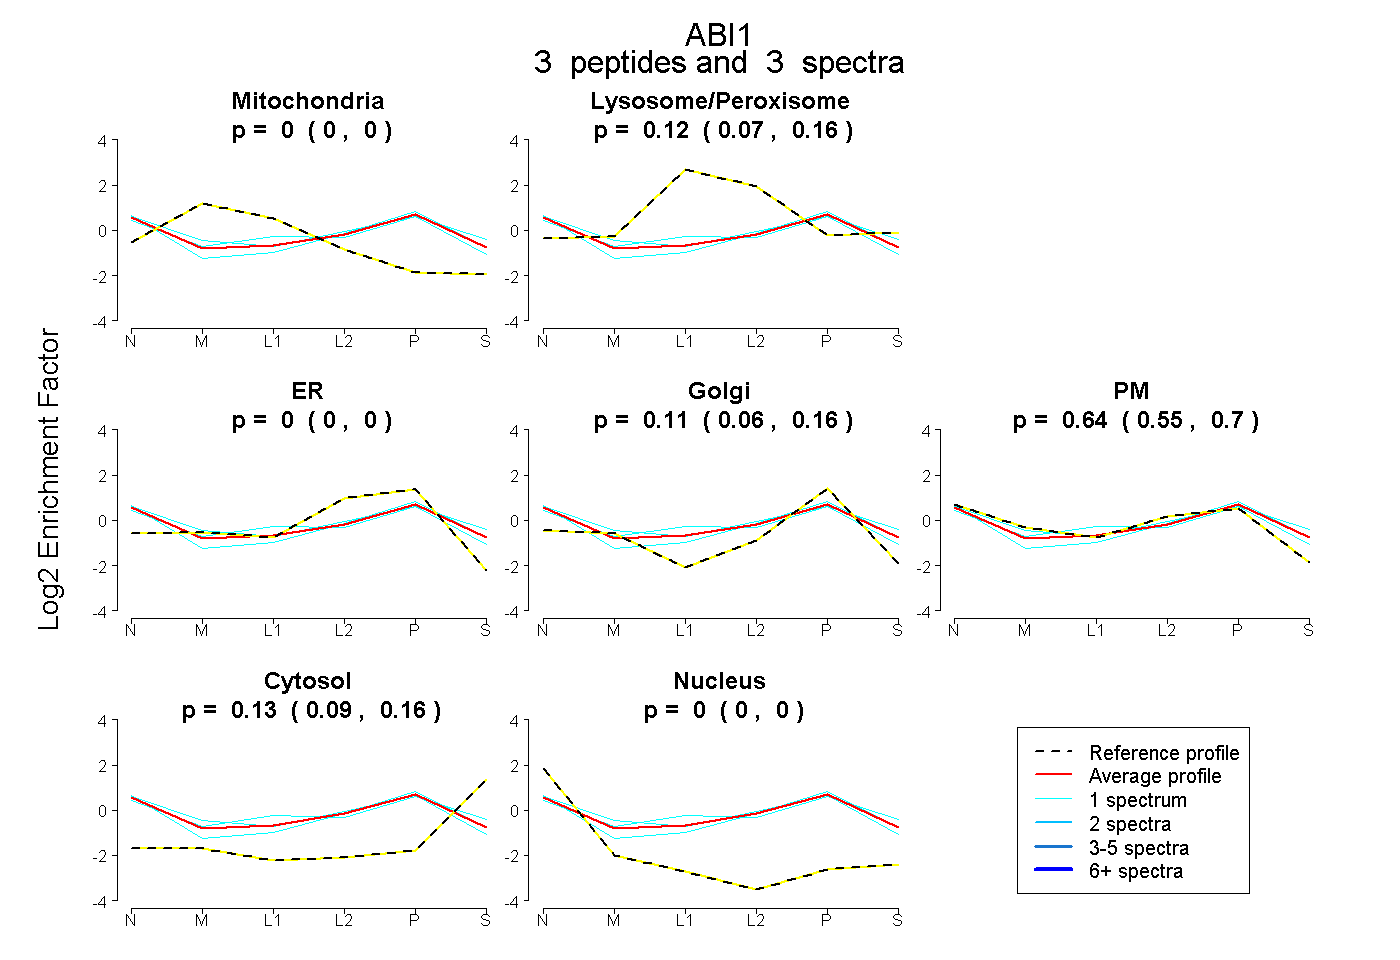
0.000 | 0.000
0.068 | 0.161
0.000 | 0.000
0.059 | 0.159
0.547 | 0.701
0.094 | 0.161
0.000 | 0.003
7peptides
spectra
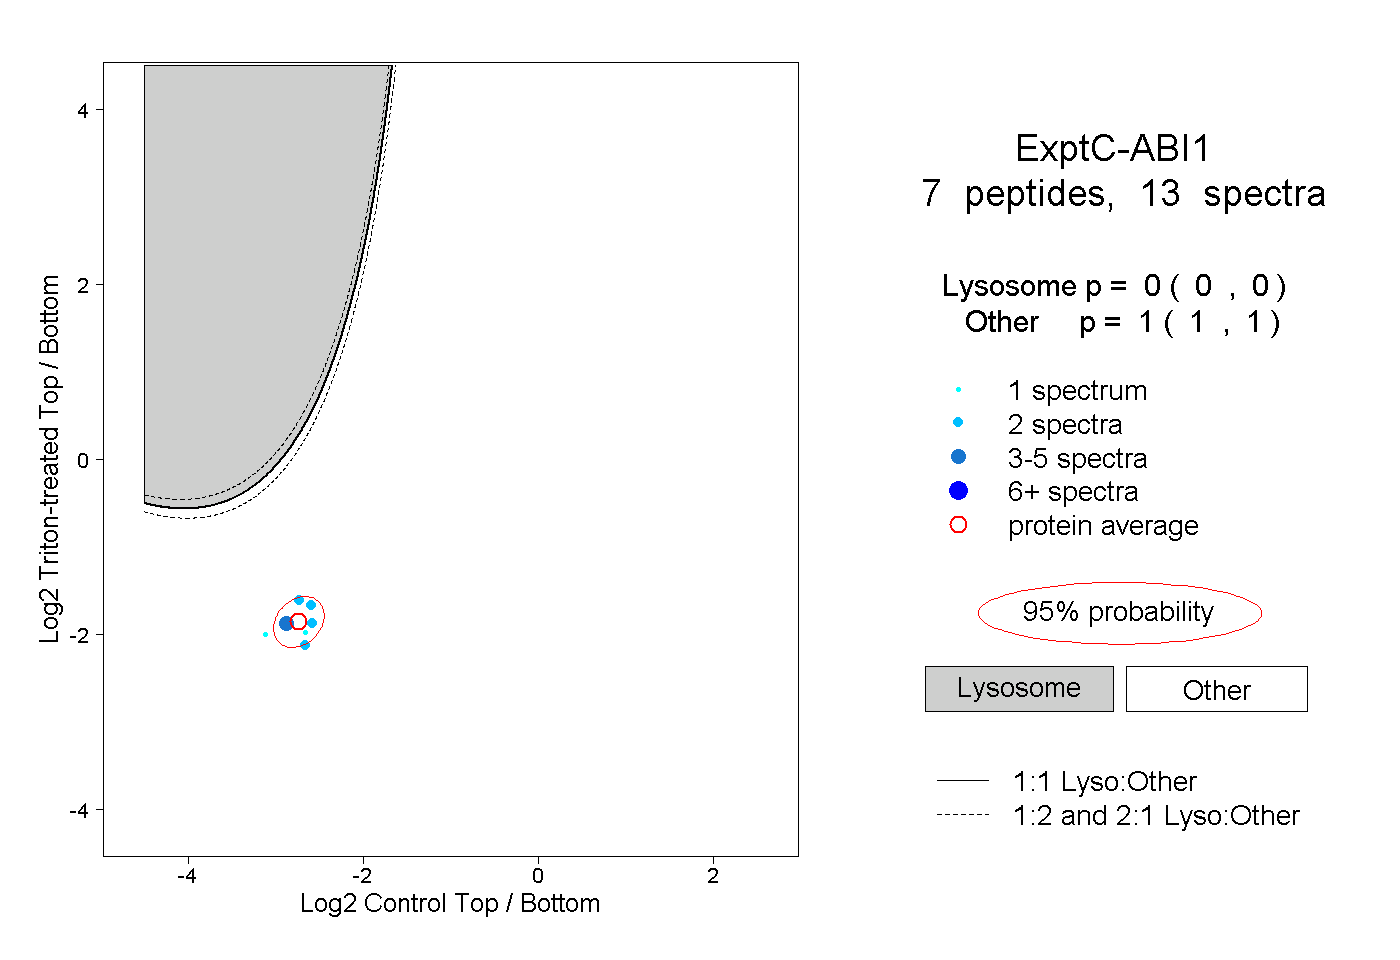
0.000 | 0.000
1.000 | 1.000