 8
8peptides
spectra
0.000 | 0.000
0.000 | 0.000
0.000 | 0.018
0.111 | 0.185
0.000 | 0.037
0.575 | 0.633
0.209 | 0.236
0.000 | 0.000
| Plot | Mito | Lyso | Perox | ER | Golgi | PM | Cytosol | Nucleus | |||||
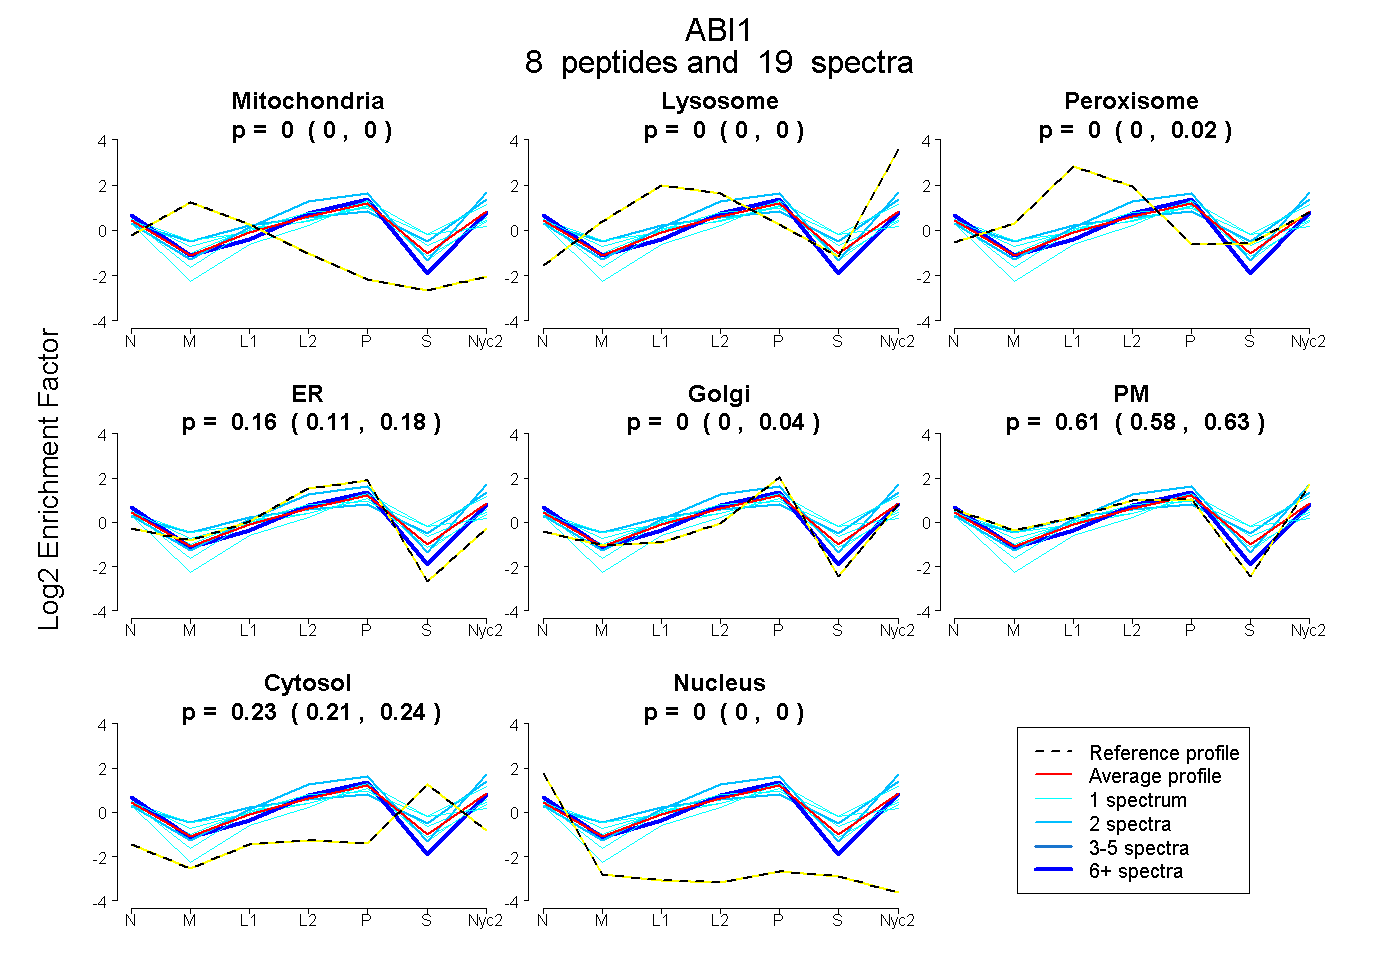
| Expt A |
8 peptides |
19 spectra |
|
0.000 0.000 | 0.000 |
0.000 0.000 | 0.000 |
0.000 0.000 | 0.018 |
0.158 0.111 | 0.185 |
0.001 0.000 | 0.037 |
0.614 0.575 | 0.633 |
0.227 0.209 | 0.236 |
0.000 0.000 | 0.000 |
| 1 spectrum, VVAIYDYTK | 0.000 | 0.008 | 0.071 | 0.000 | 0.000 | 0.613 | 0.308 | 0.000 | ||
| 2 spectra, EGAIIYVIK | 0.000 | 0.103 | 0.092 | 0.000 | 0.000 | 0.579 | 0.226 | 0.000 | ||
| 1 spectrum, EIGILTTNK | 0.022 | 0.000 | 0.052 | 0.192 | 0.076 | 0.466 | 0.191 | 0.001 | ||
| 1 spectrum, KPIDYTVLDDVGHGVK | 0.000 | 0.000 | 0.019 | 0.232 | 0.055 | 0.525 | 0.169 | 0.000 | ||
| 2 spectra, TASLNQRPR | 0.000 | 0.119 | 0.000 | 0.129 | 0.115 | 0.559 | 0.078 | 0.000 | ||
| 10 spectra, IIAPANMERPVR | 0.000 | 0.000 | 0.000 | 0.186 | 0.163 | 0.539 | 0.075 | 0.038 | ||
| 1 spectrum, TNPPTQKPPSPPVSGR | 0.000 | 0.000 | 0.000 | 0.212 | 0.219 | 0.176 | 0.393 | 0.000 | ||
| 1 spectrum, ALEETK | 0.000 | 0.000 | 0.077 | 0.160 | 0.034 | 0.462 | 0.267 | 0.000 |
| Plot | Mito | Lyso or Perox | ER | Golgi | PM | Cytosol | Nucleus | ||||||
| Expt B |
3 peptides |
3 spectra |
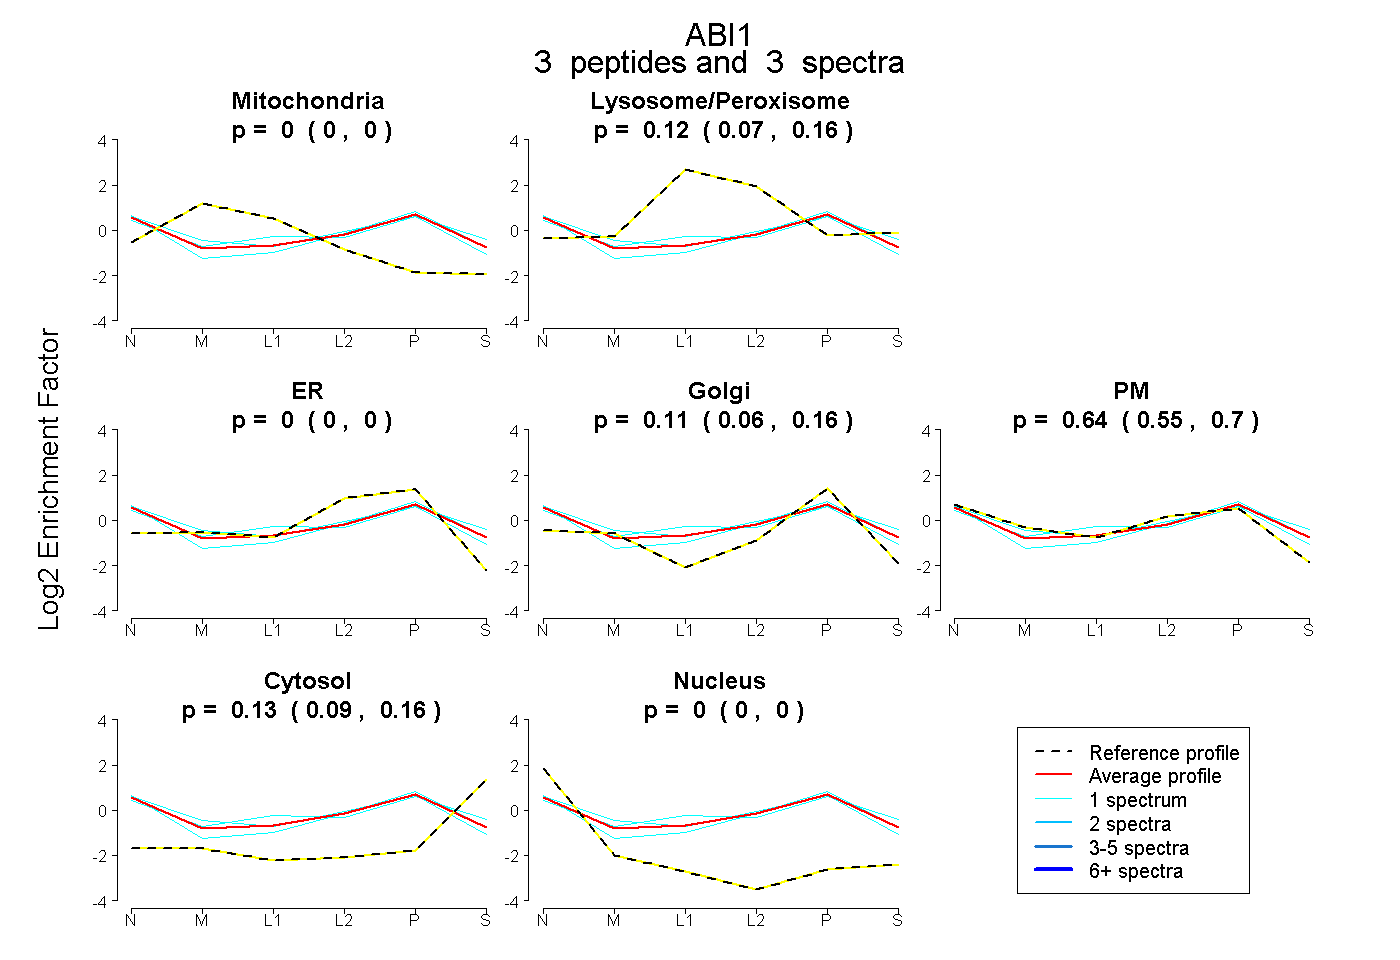 |
0.000 0.000 | 0.000 |
0.119 0.068 | 0.161 |
0.000 0.000 | 0.000 |
0.113 0.059 | 0.159 |
0.636 0.547 | 0.701 |
0.133 0.094 | 0.161 |
0.000 0.000 | 0.003 |
|||
| Plot | Lyso | Other | |||||||||||
| Expt C |
7 peptides |
13 spectra |
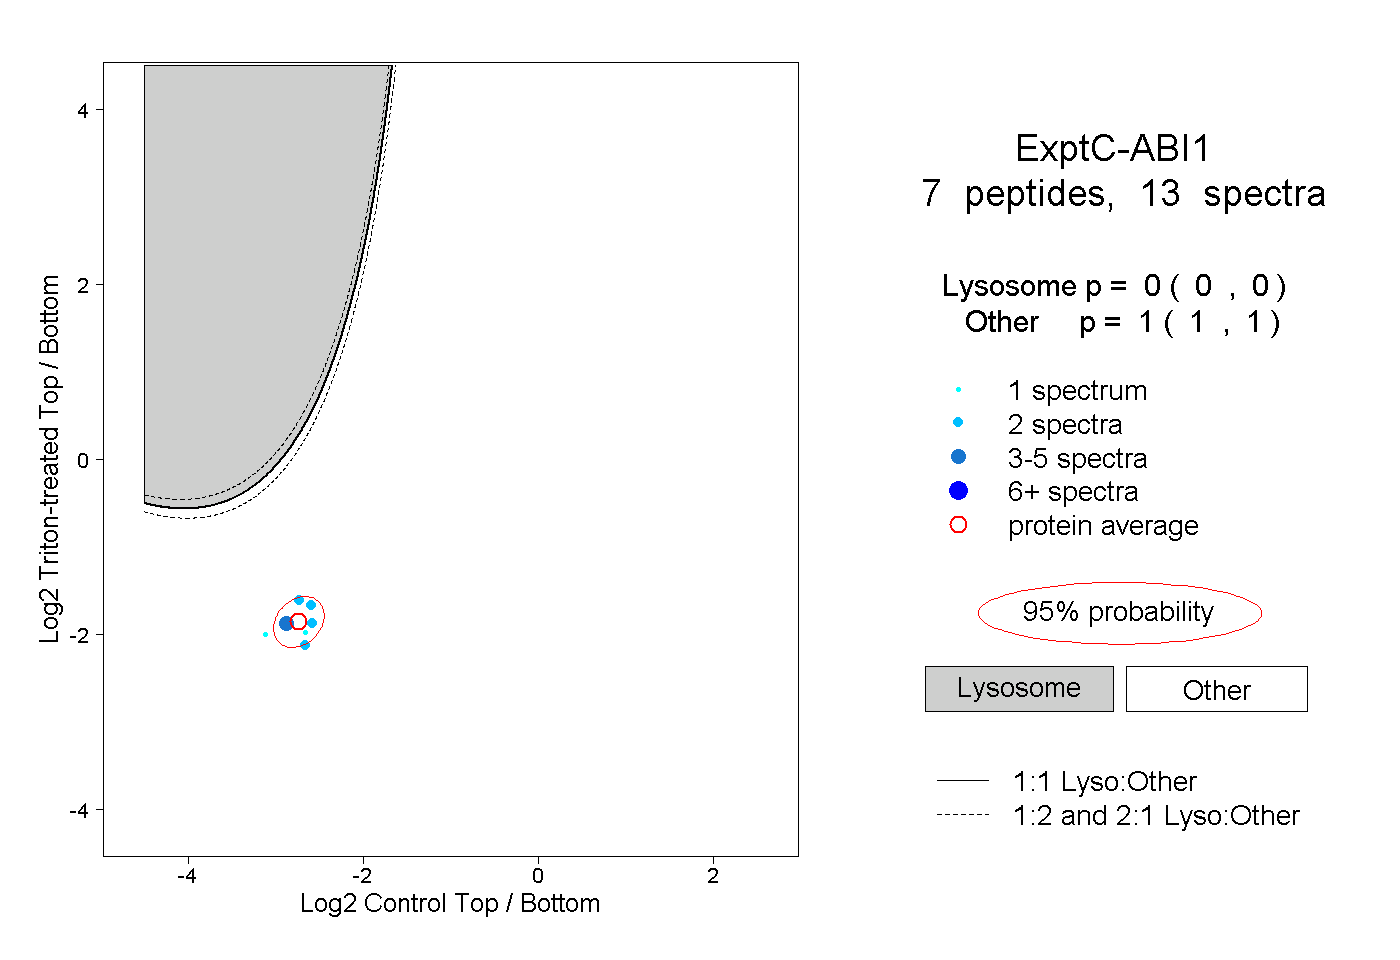 |
0.000 0.000 | 0.000 |
1.000 1.000 | 1.000 |