 6
6peptides
spectra
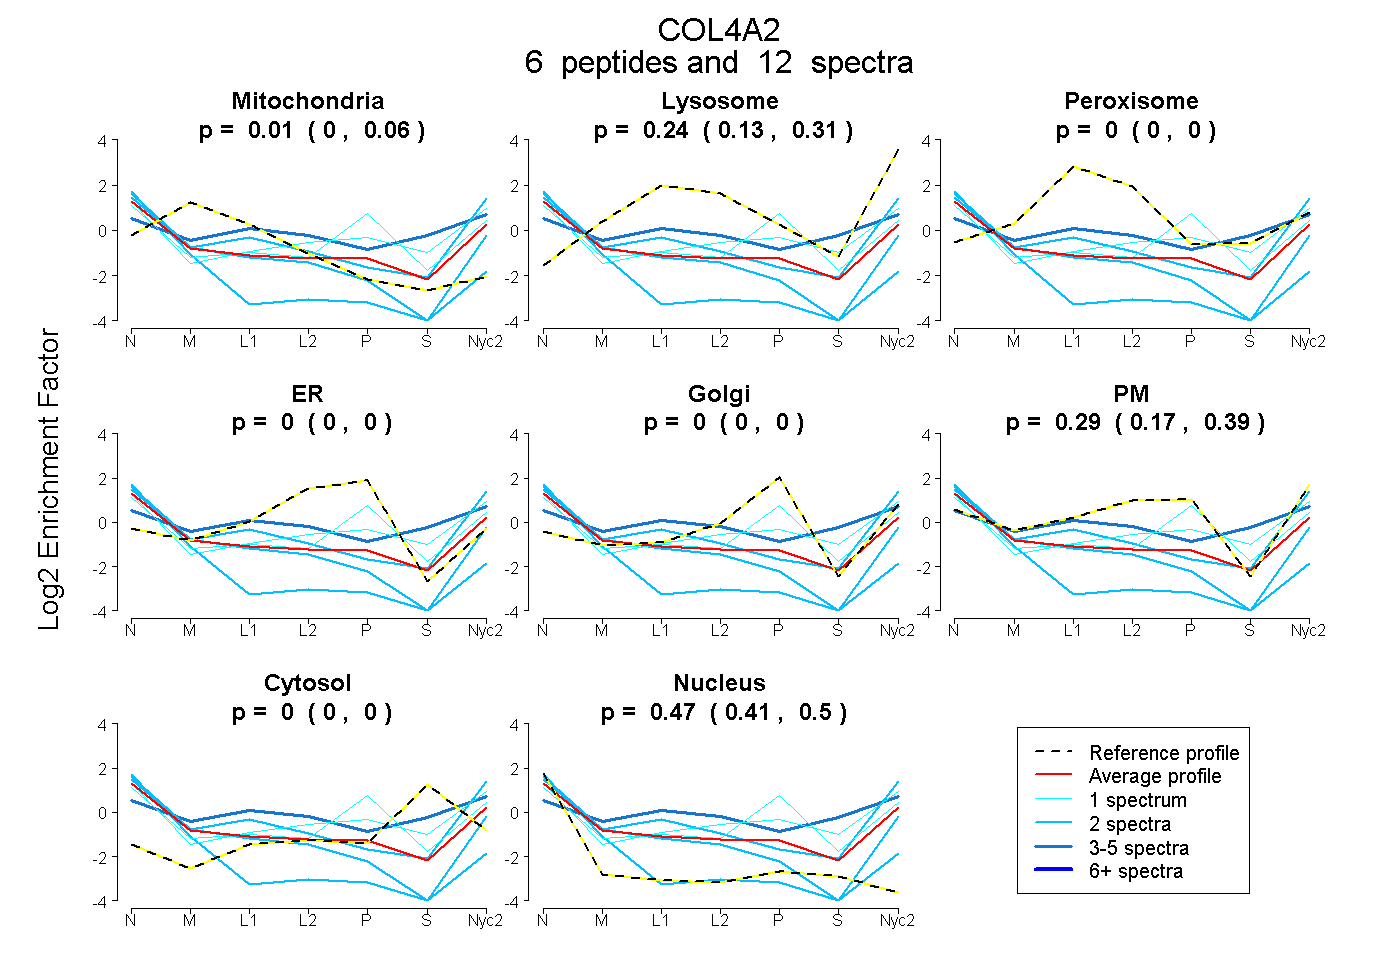
0.000 | 0.063
0.129 | 0.310
0.000 | 0.000
0.000 | 0.000
0.000 | 0.000
0.168 | 0.395
0.000 | 0.000
0.412 | 0.497
1peptide
spectrum
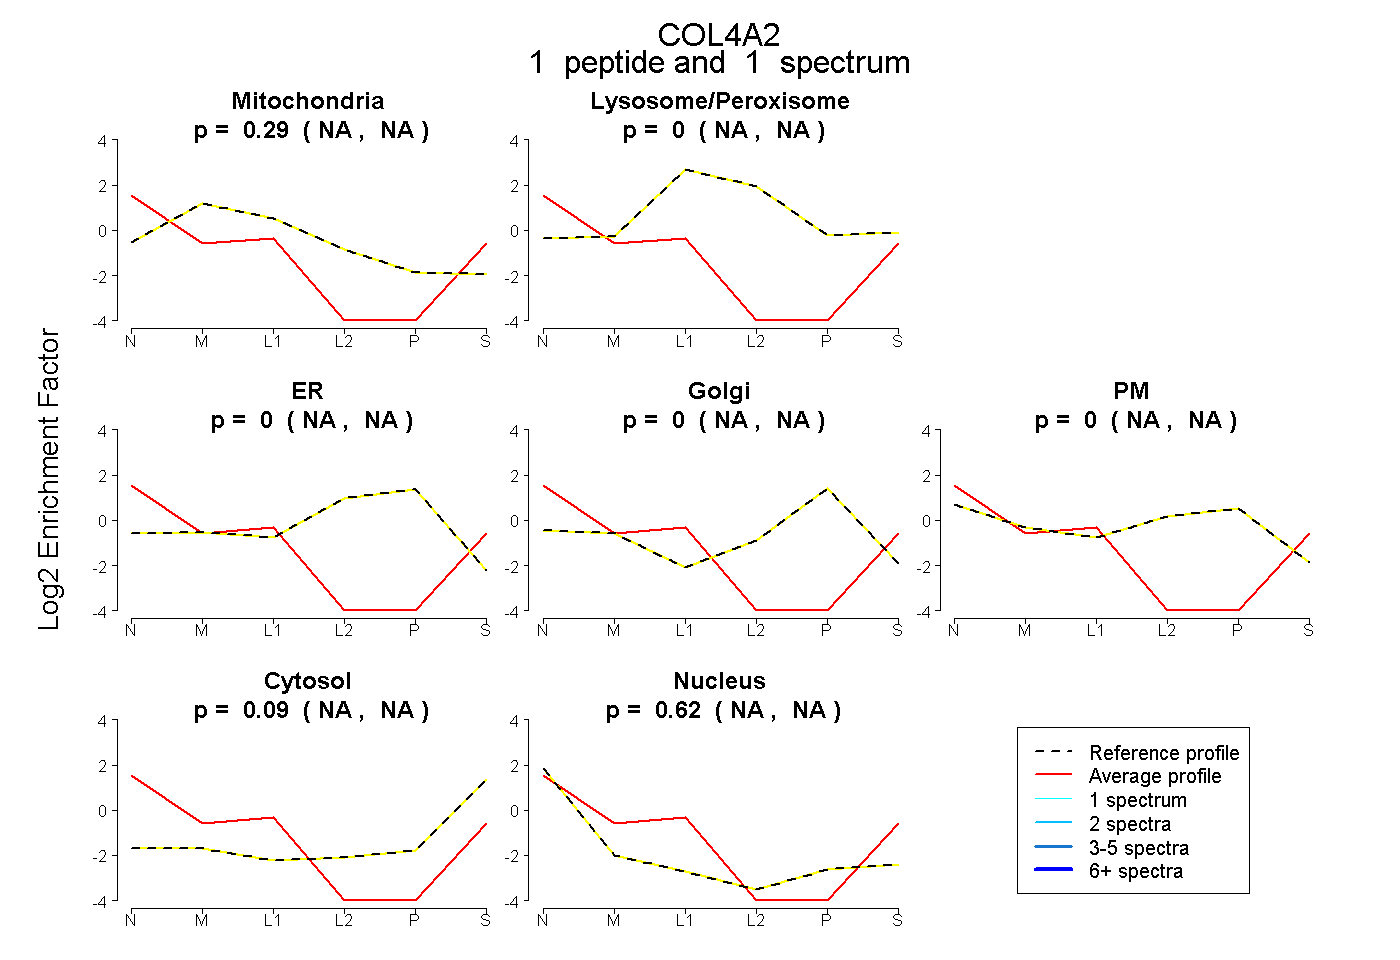
NA | NA
NA | NA
NA | NA
NA | NA
NA | NA
NA | NA
NA | NA
2peptides
spectra
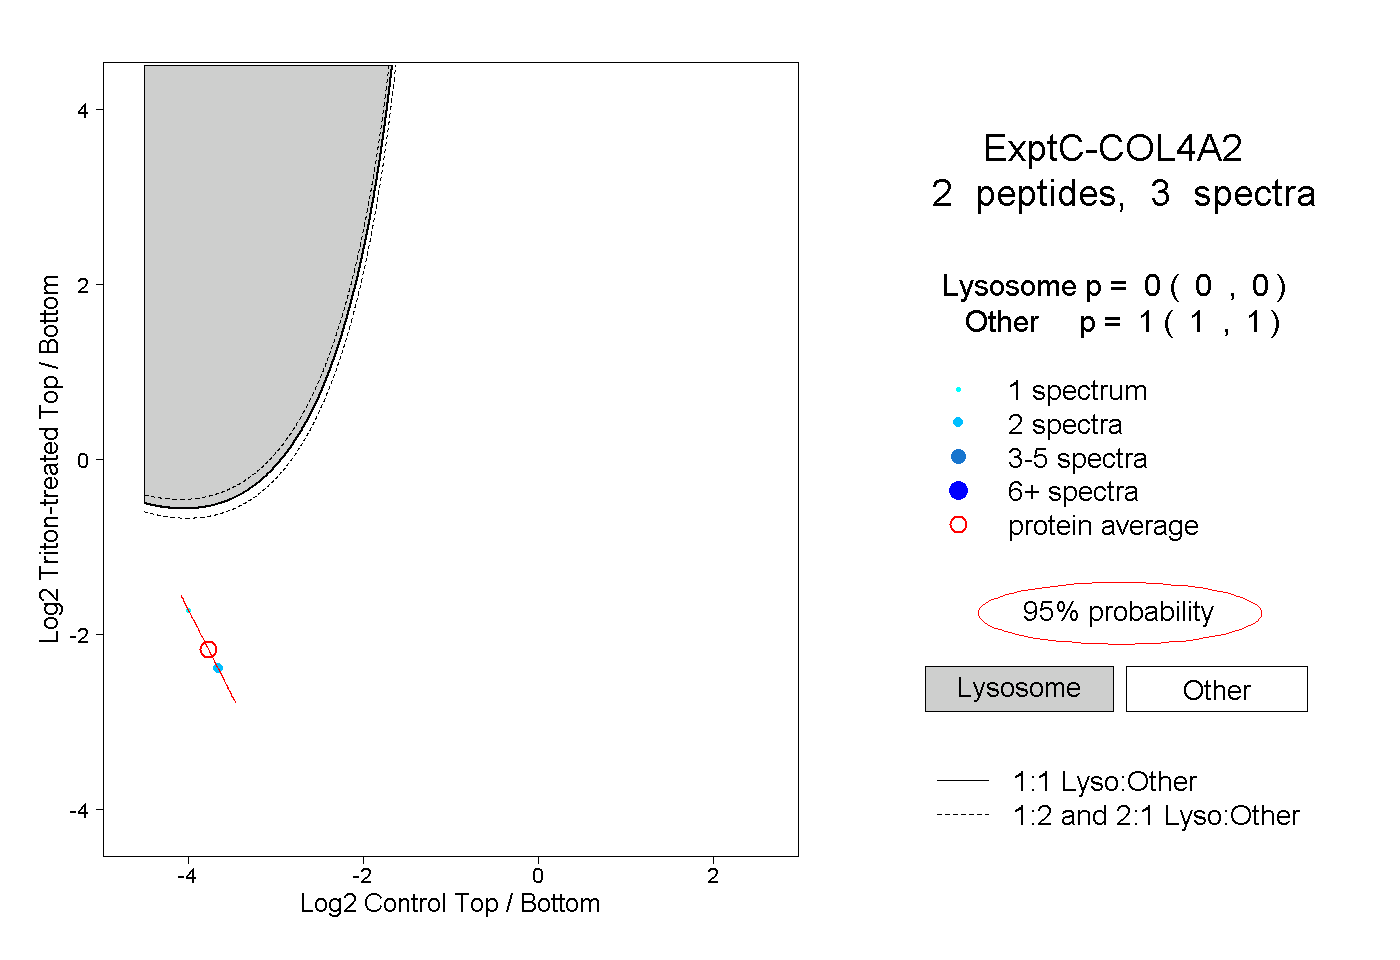
0.000 | 0.000
1.000 | 1.000