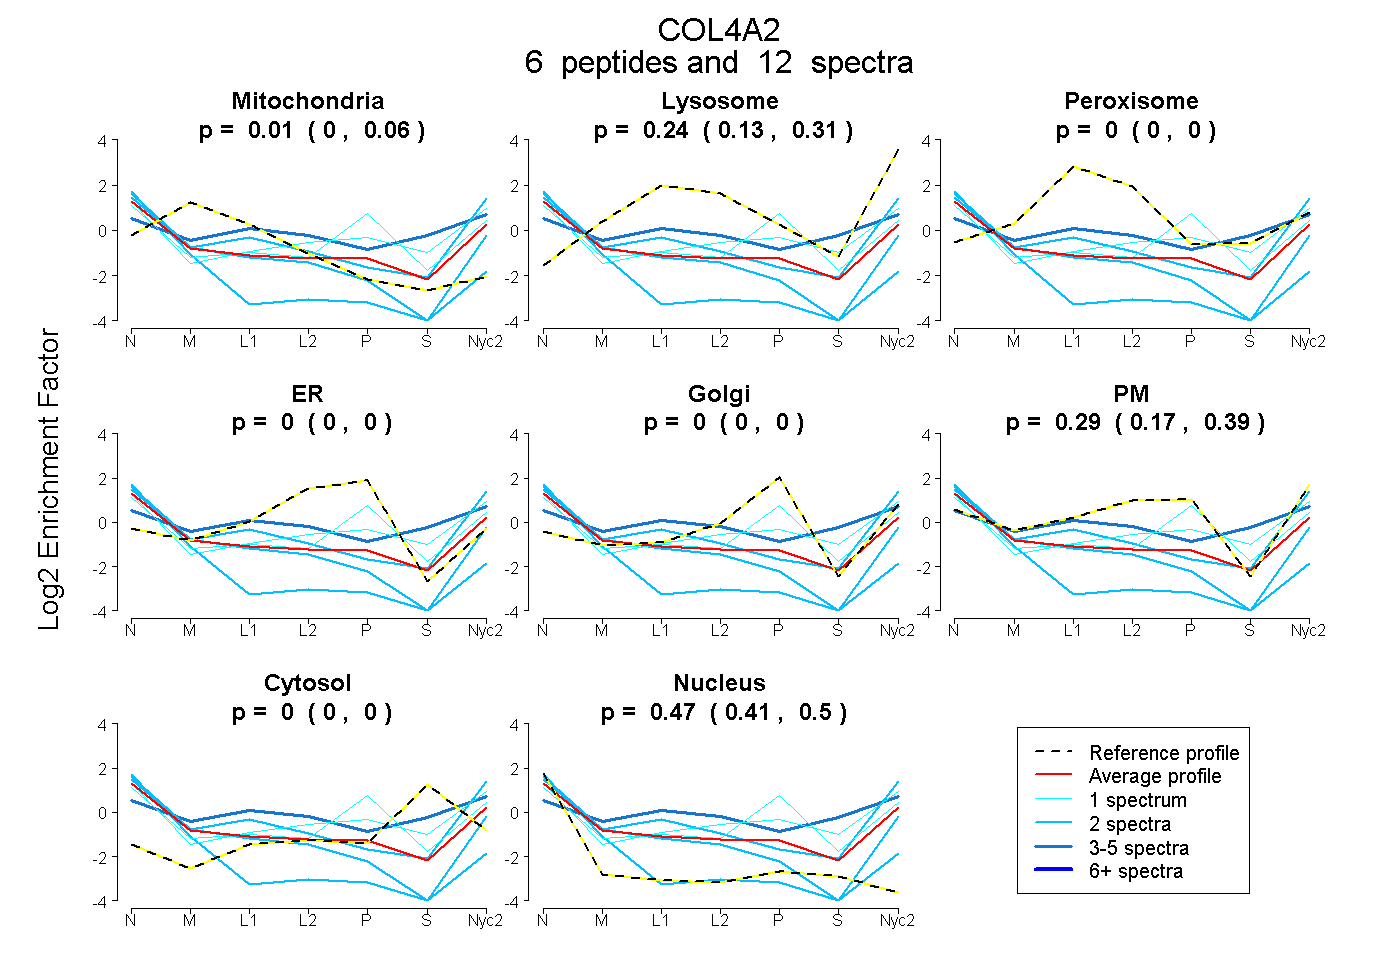
 6
6peptides
spectra
0.000 | 0.063
0.129 | 0.310
0.000 | 0.000
0.000 | 0.000
0.000 | 0.000
0.168 | 0.395
0.000 | 0.000
0.412 | 0.497
| Plot | Mito | Lyso | Perox | ER | Golgi | PM | Cytosol | Nucleus | |||||
| Expt A |
6 peptides |
12 spectra |
|
0.009 0.000 | 0.063 |
0.236 0.129 | 0.310 |
0.000 0.000 | 0.000 |
0.000 0.000 | 0.000 |
0.000 0.000 | 0.000 |
0.289 0.168 | 0.395 |
0.000 0.000 | 0.000 |
0.466 0.412 | 0.497 |
| 2 spectra, IAVQPGTMGPQGR | 0.207 | 0.000 | 0.000 | 0.000 | 0.000 | 0.374 | 0.000 | 0.419 | ||
| 2 spectra, ATPFIECNGGR | 0.000 | 0.419 | 0.000 | 0.000 | 0.000 | 0.171 | 0.000 | 0.411 | ||
| 2 spectra, GLDGFQGPSGPR | 0.183 | 0.000 | 0.000 | 0.000 | 0.000 | 0.045 | 0.000 | 0.772 | ||
| 1 spectrum, GTCHYFANK | 0.000 | 0.000 | 0.000 | 0.000 | 0.333 | 0.377 | 0.066 | 0.223 | ||
| 4 spectra, AHNQDLGLAGSCLAR | 0.027 | 0.082 | 0.245 | 0.000 | 0.000 | 0.260 | 0.285 | 0.102 | ||
| 1 spectrum, SVSIGYLLVK | 0.000 | 0.000 | 0.000 | 0.000 | 0.000 | 0.588 | 0.255 | 0.157 |
| Plot | Mito | Lyso or Perox | ER | Golgi | PM | Cytosol | Nucleus | ||||||
| Expt B |
1 peptide |
1 spectrum |
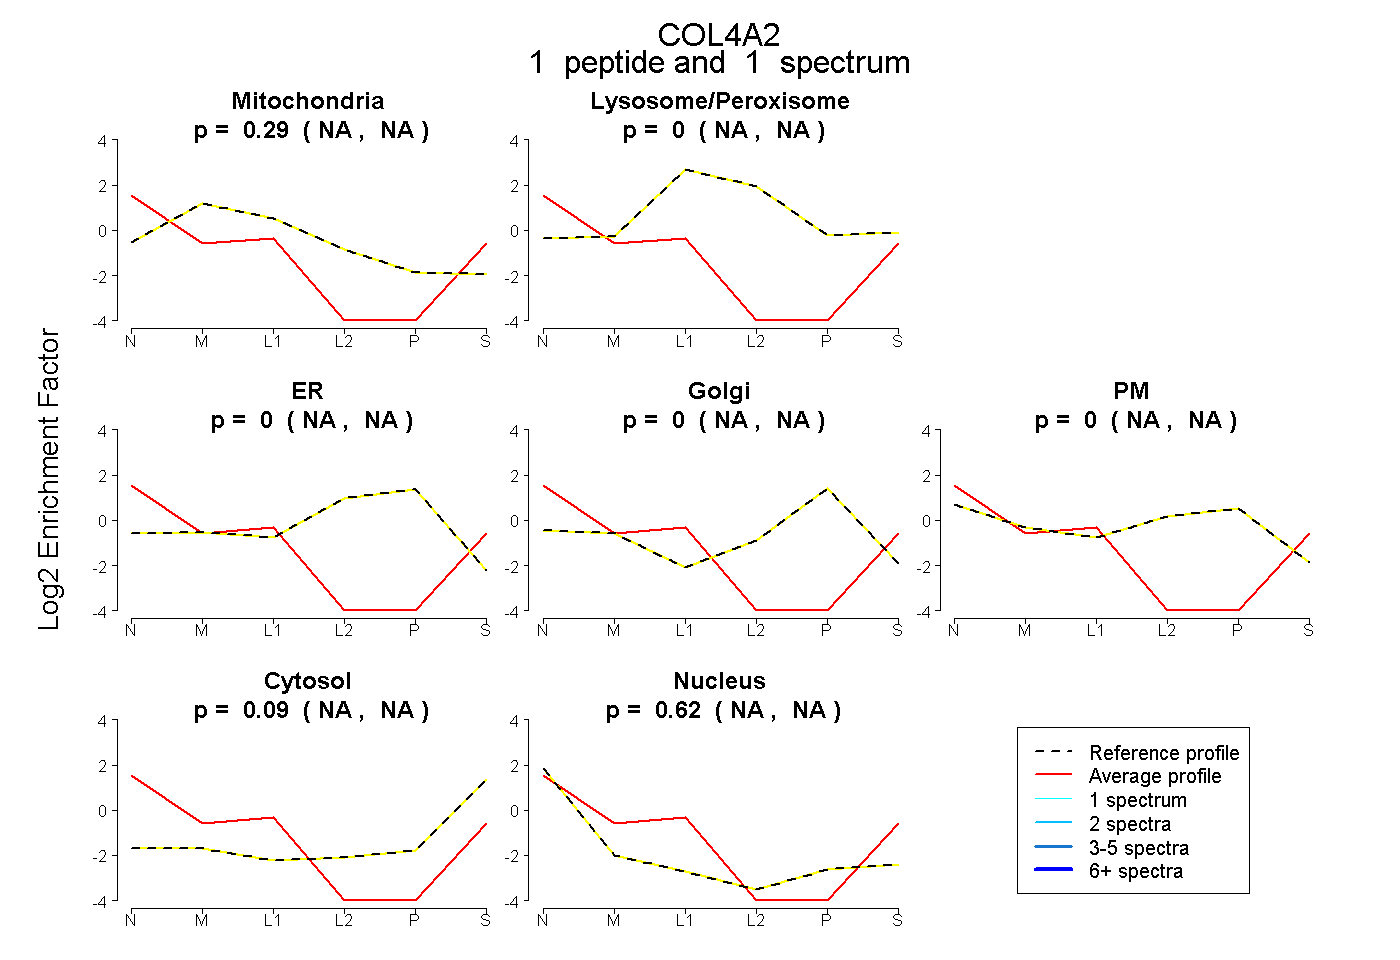 |
0.287 NA | NA |
0.000 NA | NA |
0.000 NA | NA |
0.000 NA | NA |
0.000 NA | NA |
0.092 NA | NA |
0.621 NA | NA |
|||
| Plot | Lyso | Other | |||||||||||
| Expt C |
2 peptides |
3 spectra |
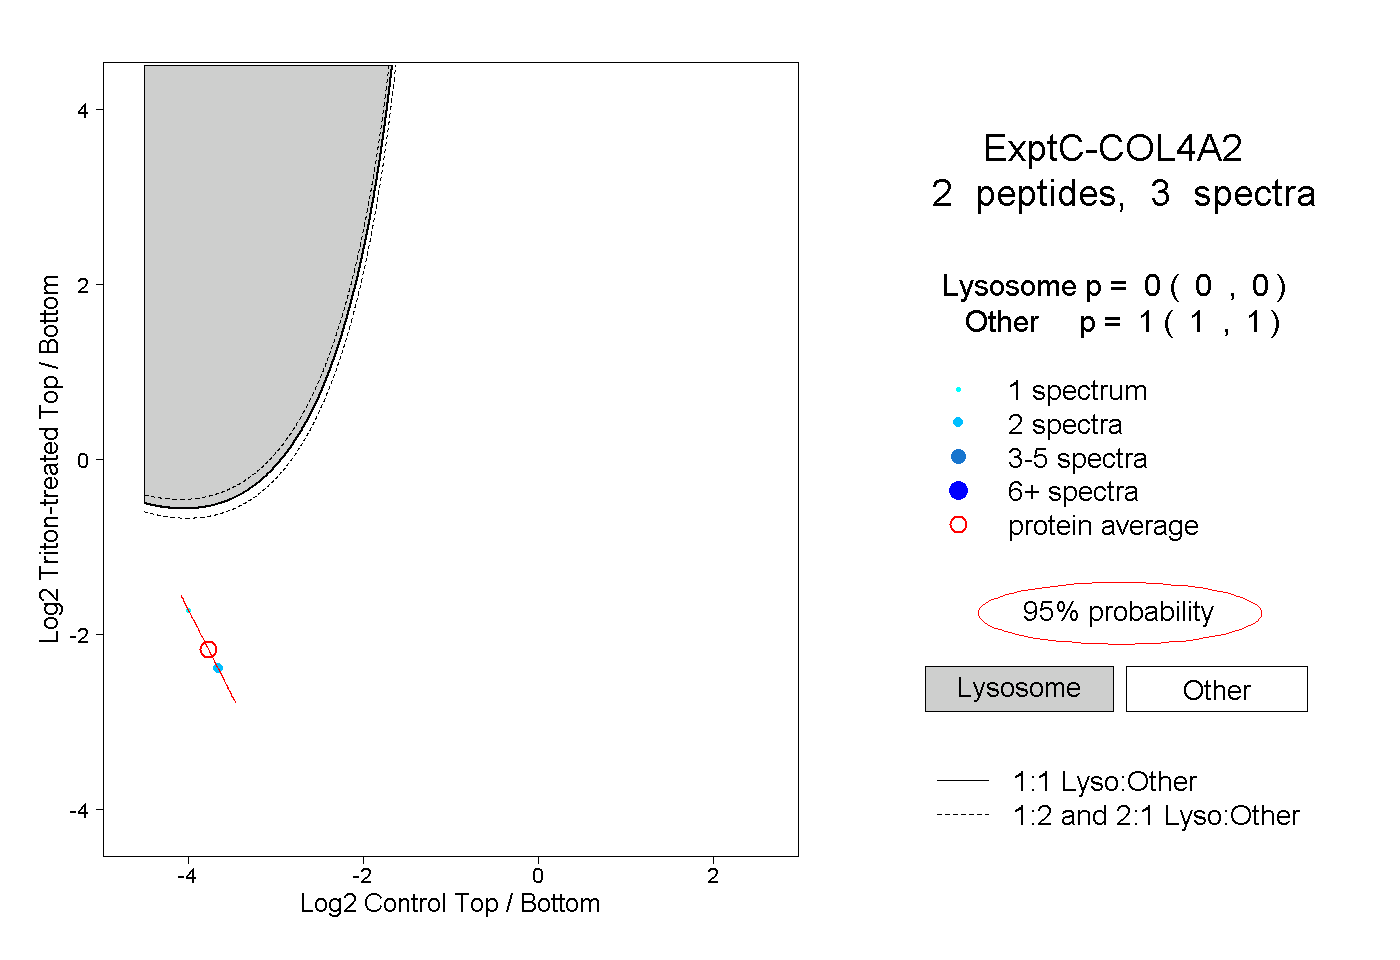 |
0.000 0.000 | 0.000 |
1.000 1.000 | 1.000 |