 11
11peptides
spectra
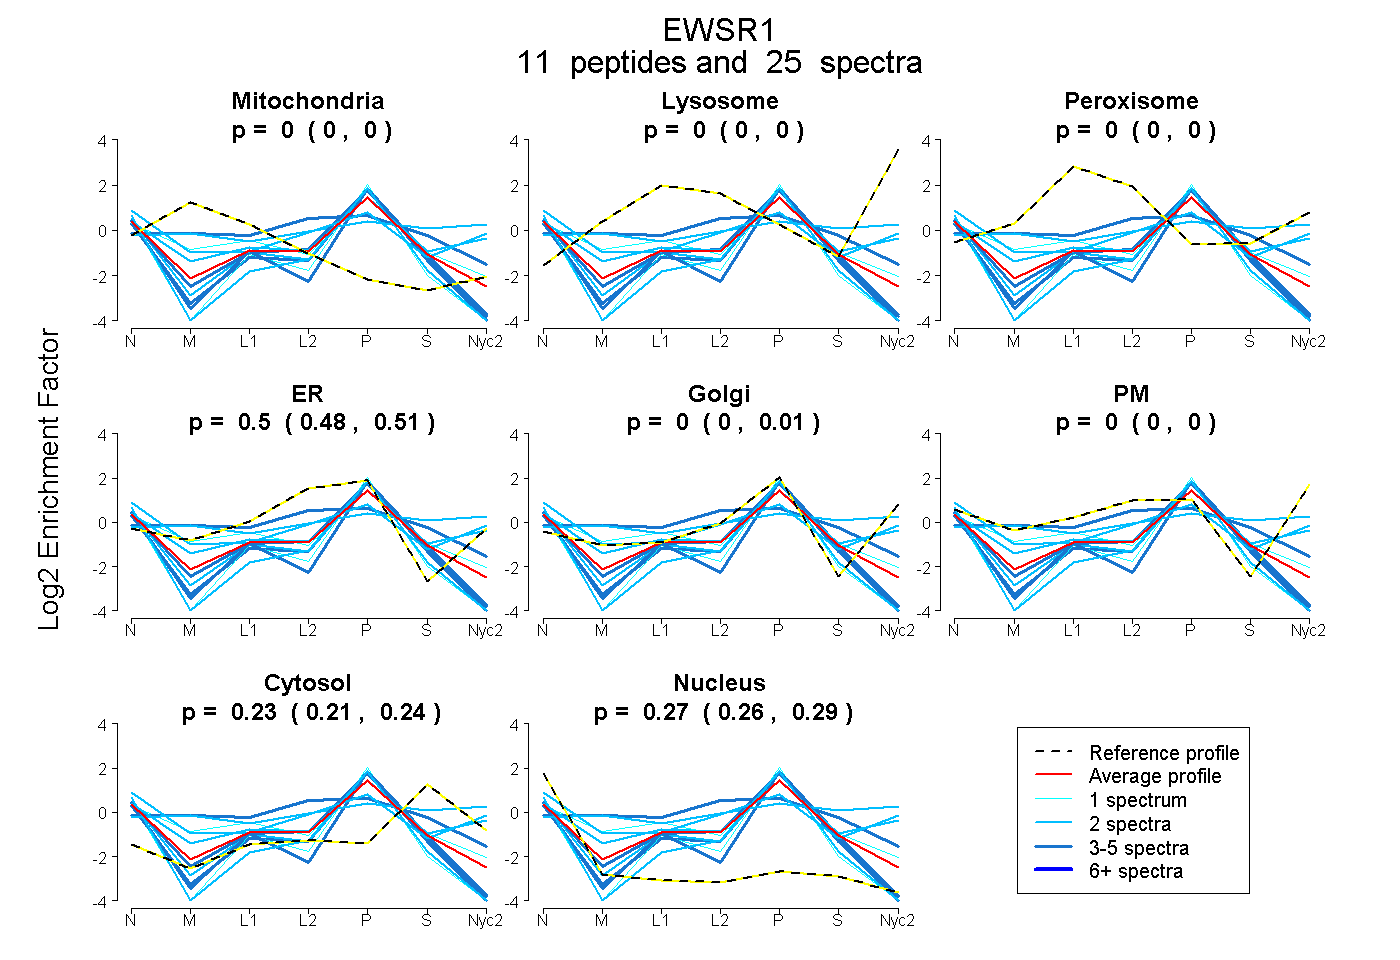
0.000 | 0.000
0.000 | 0.000
0.000 | 0.000
0.477 | 0.508
0.000 | 0.006
0.000 | 0.000
0.211 | 0.244
0.257 | 0.288
4peptides
spectra
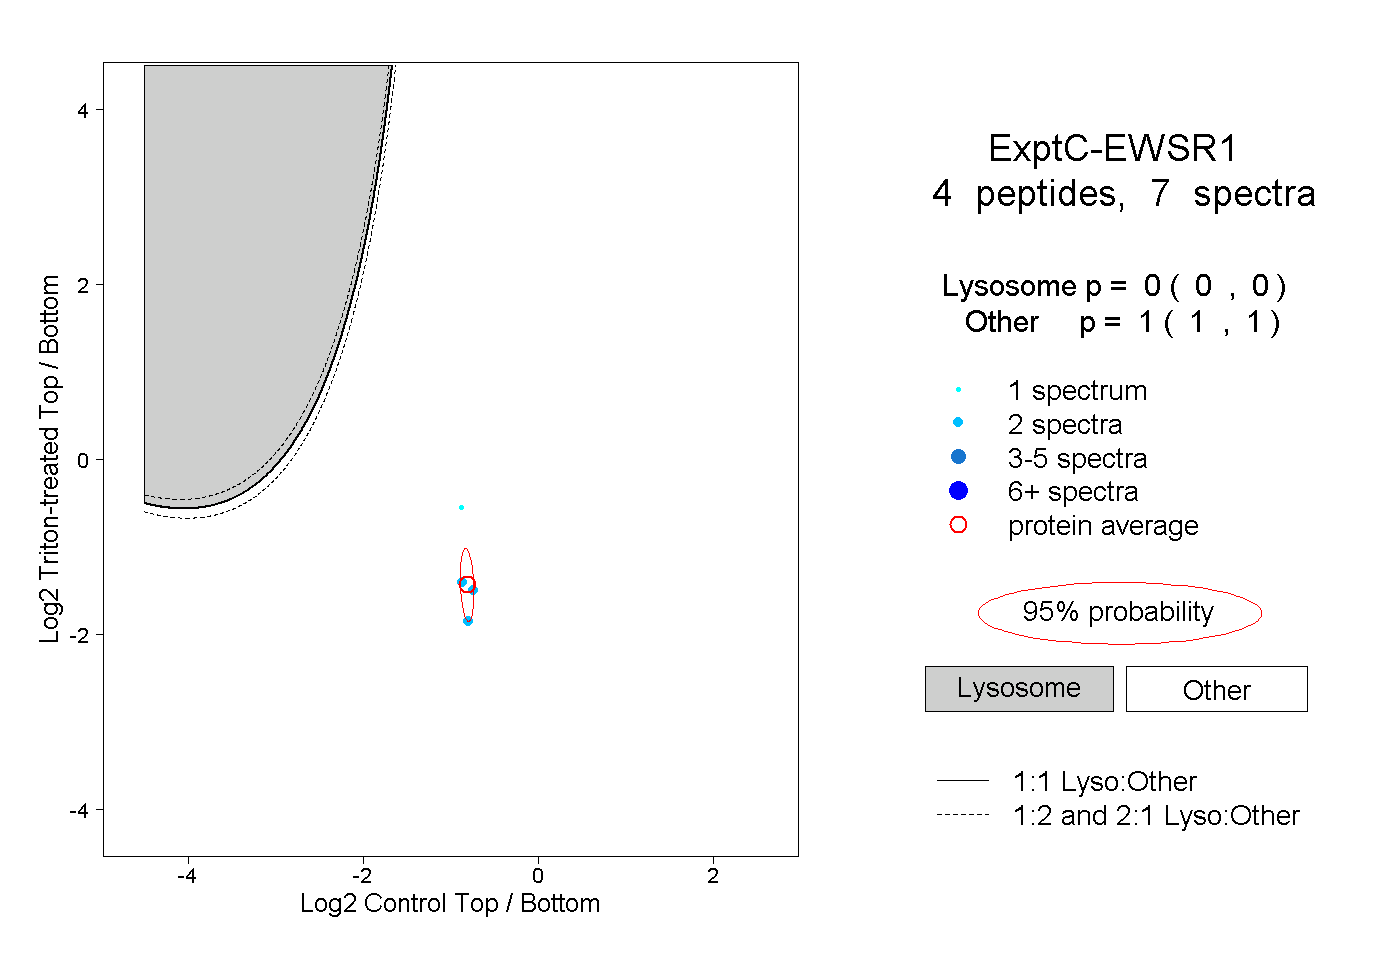
0.000 | 0.000
1.000 | 1.000
2peptides
spectra
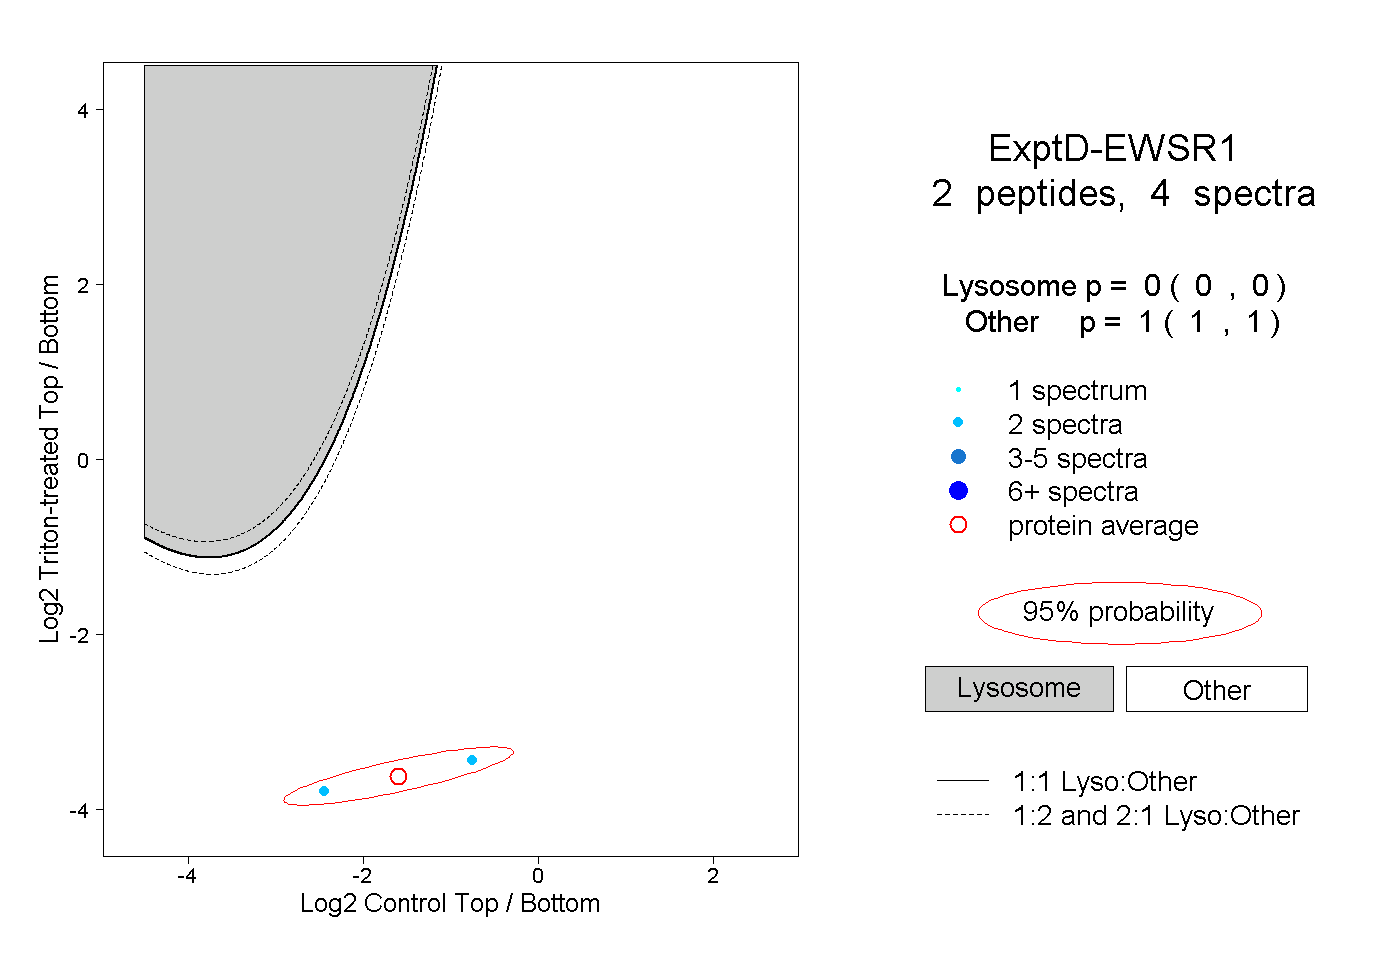
0.000 | 0.000
1.000 | 1.000