 11
11peptides
spectra
0.000 | 0.000
0.000 | 0.000
0.000 | 0.000
0.477 | 0.508
0.000 | 0.006
0.000 | 0.000
0.211 | 0.244
0.257 | 0.288
| Plot | Mito | Lyso | Perox | ER | Golgi | PM | Cytosol | Nucleus | |||||
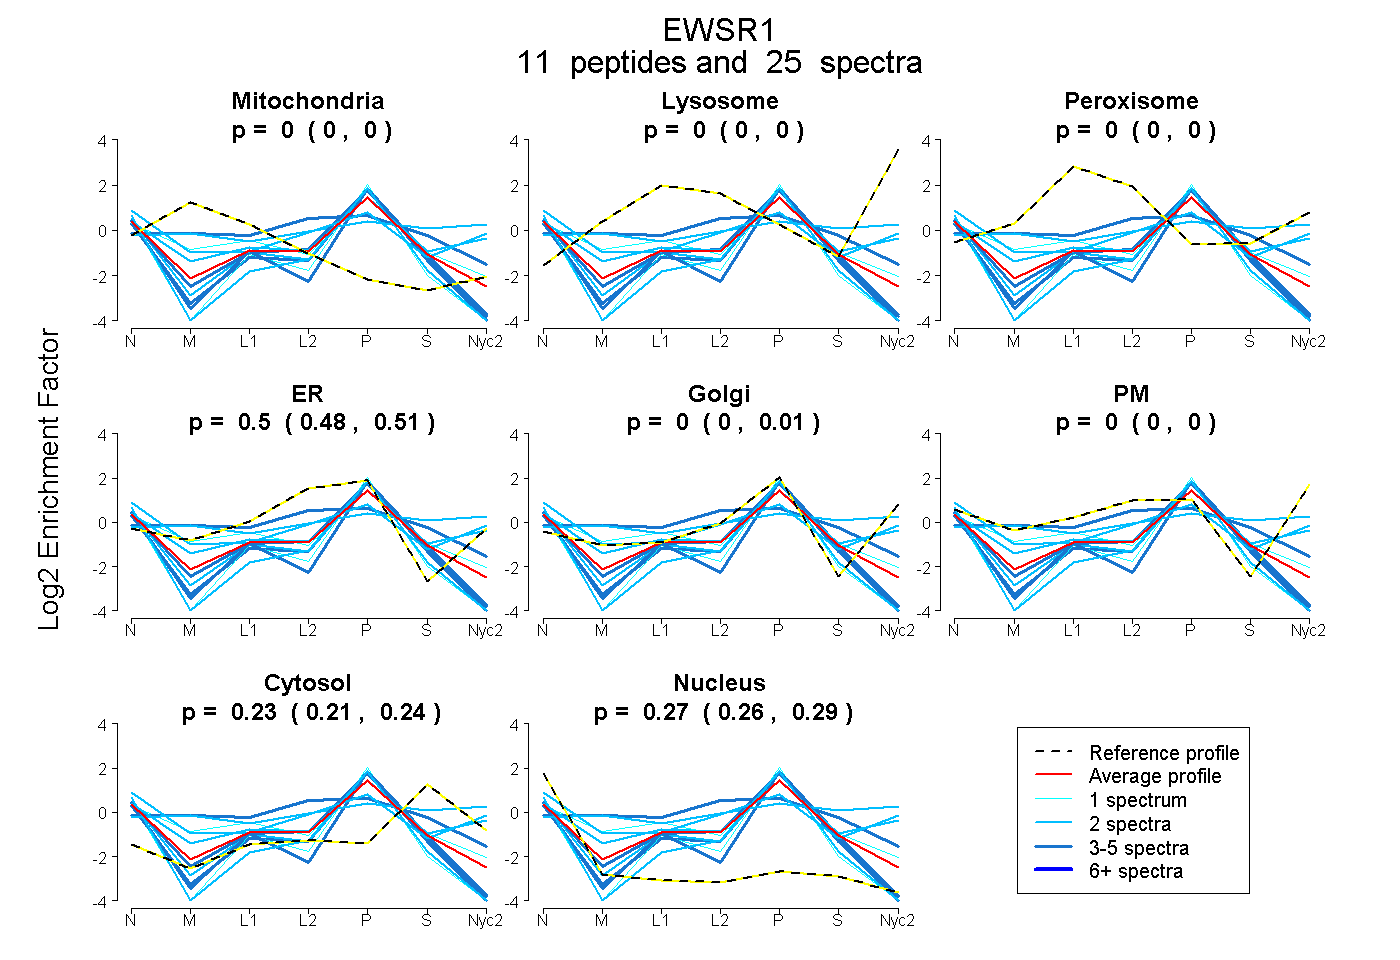
| Expt A |
11 peptides |
25 spectra |
|
0.000 0.000 | 0.000 |
0.000 0.000 | 0.000 |
0.000 0.000 | 0.000 |
0.496 0.477 | 0.508 |
0.000 0.000 | 0.006 |
0.000 0.000 | 0.000 |
0.230 0.211 | 0.244 |
0.274 0.257 | 0.288 |
| 3 spectra, QCGVVK | 0.000 | 0.000 | 0.000 | 0.492 | 0.000 | 0.000 | 0.140 | 0.369 | ||
| 2 spectra, GDATVSYEDPPTAK | 0.000 | 0.000 | 0.000 | 0.437 | 0.000 | 0.000 | 0.144 | 0.419 | ||
| 2 spectra, TECNQCK | 0.000 | 0.000 | 0.000 | 0.415 | 0.000 | 0.000 | 0.059 | 0.525 | ||
| 2 spectra, SLSGPDNR | 0.000 | 0.000 | 0.030 | 0.025 | 0.630 | 0.000 | 0.216 | 0.100 | ||
| 1 spectrum, AGDWQCPNPGCGNQNFAWR | 0.000 | 0.000 | 0.000 | 0.439 | 0.000 | 0.000 | 0.047 | 0.514 | ||
| 4 spectra, AAVEWFDGK | 0.000 | 0.000 | 0.000 | 0.412 | 0.000 | 0.000 | 0.204 | 0.384 | ||
| 2 spectra, VSLAR | 0.000 | 0.000 | 0.000 | 0.127 | 0.126 | 0.417 | 0.186 | 0.145 | ||
| 2 spectra, GNPSGGGNVQHR | 0.026 | 0.000 | 0.191 | 0.000 | 0.204 | 0.210 | 0.370 | 0.000 | ||
| 3 spectra, GMPPPLR | 0.000 | 0.000 | 0.000 | 0.357 | 0.000 | 0.000 | 0.167 | 0.476 | ||
| 1 spectrum, DFQGSK | 0.072 | 0.000 | 0.000 | 0.447 | 0.097 | 0.000 | 0.212 | 0.172 | ||
| 3 spectra, GGPGGPGGPGGPMGR | 0.157 | 0.000 | 0.096 | 0.437 | 0.000 | 0.000 | 0.309 | 0.000 |
| Plot | Lyso | Other | |||||||||||
| Expt C |
4 peptides |
7 spectra |
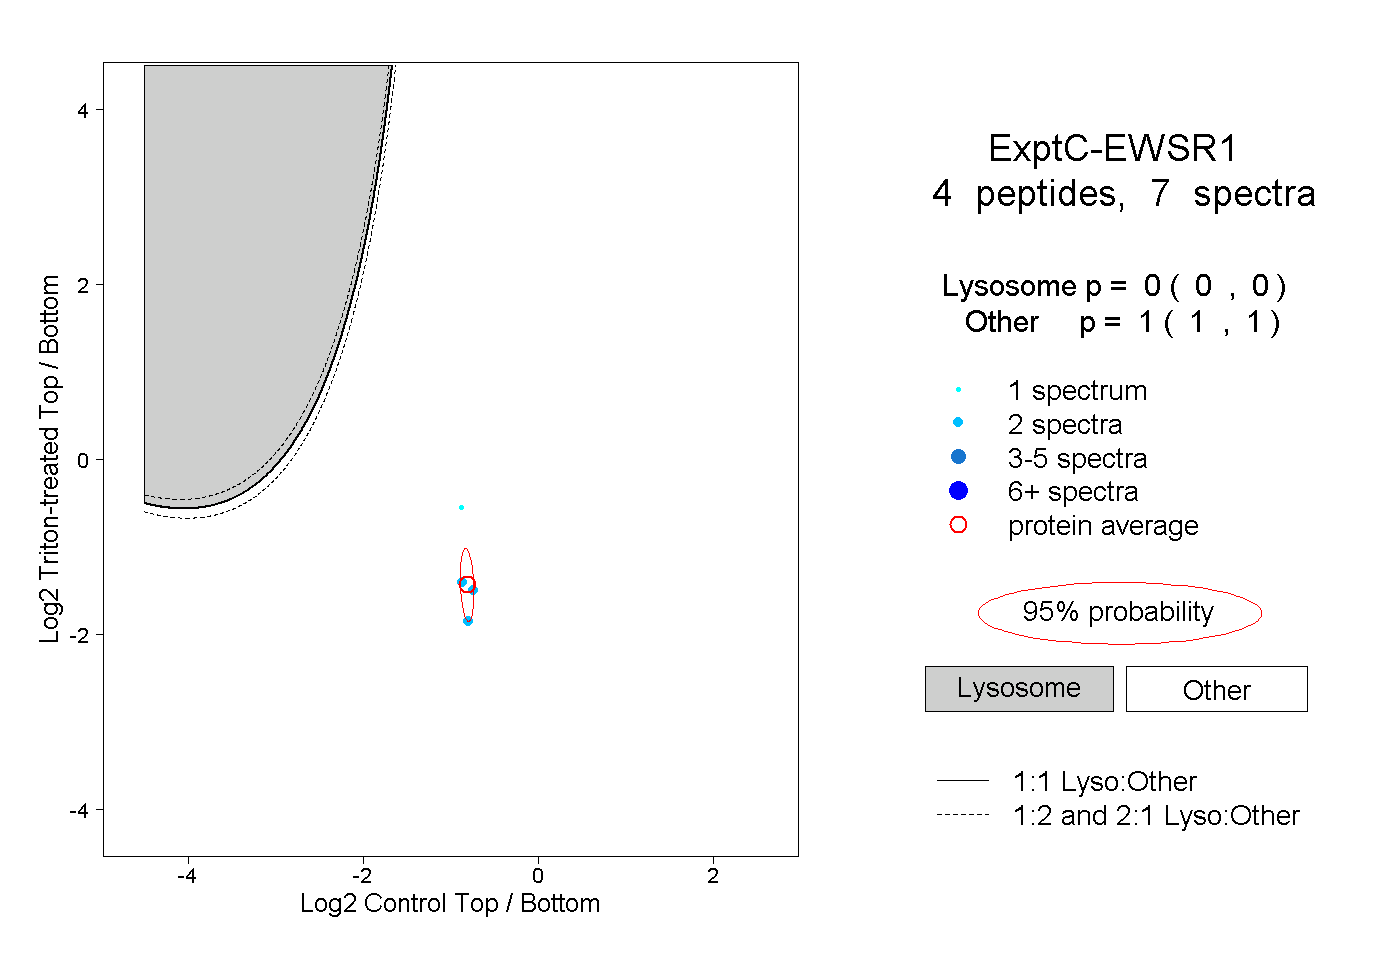 |
0.000 0.000 | 0.000 |
1.000 1.000 | 1.000 |
||||||||
| Plot | Lyso | Other | |||||||||||
| Expt D |
2 peptides |
4 spectra |
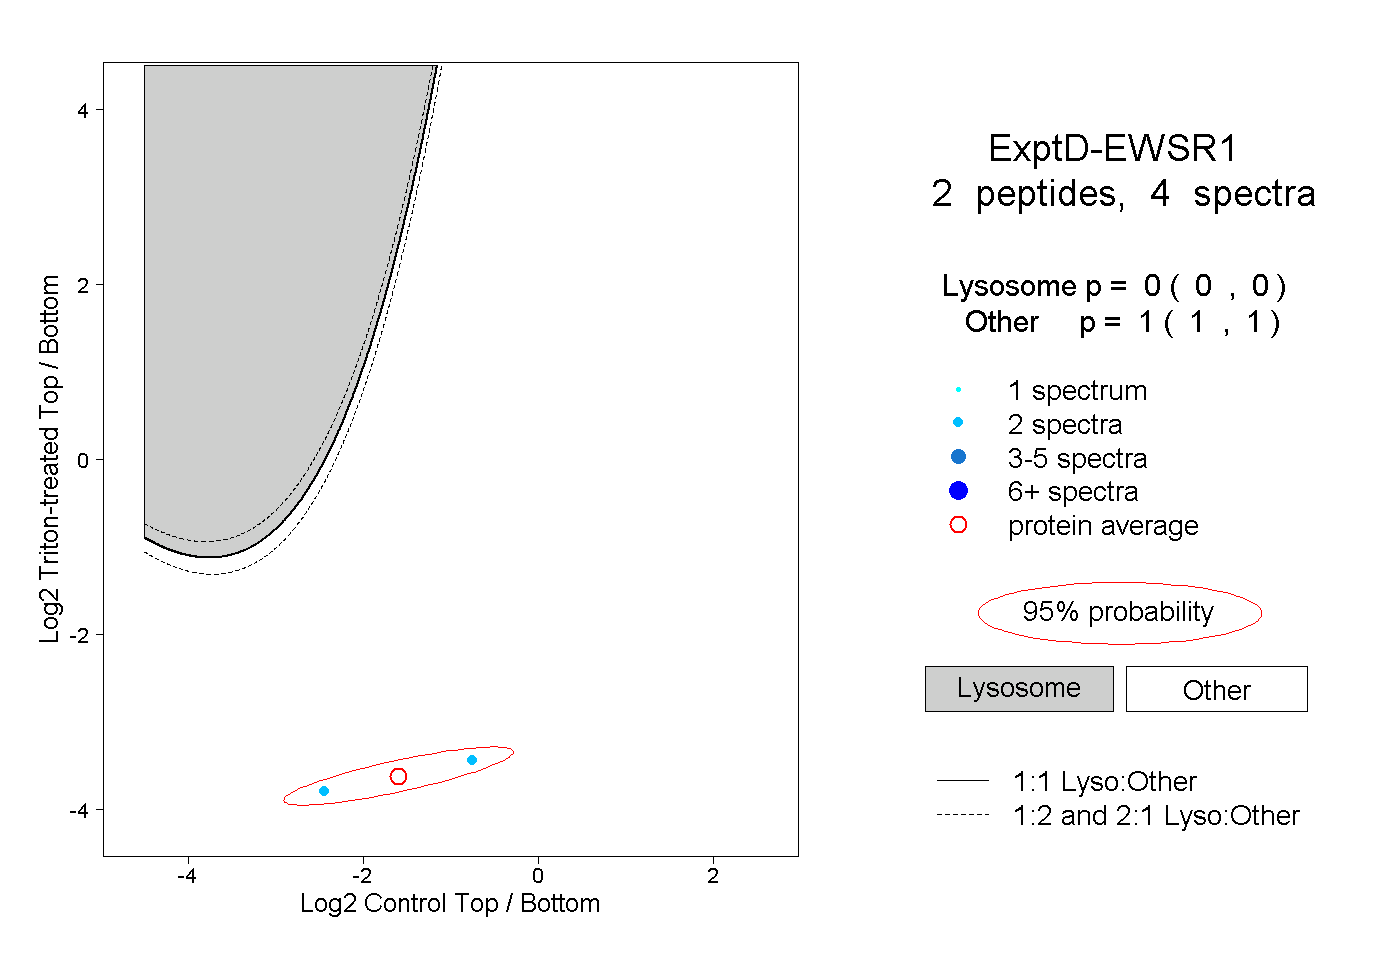 |
0.000 0.000 | 0.000 |
1.000 1.000 | 1.000 |