 11
11peptides
spectra
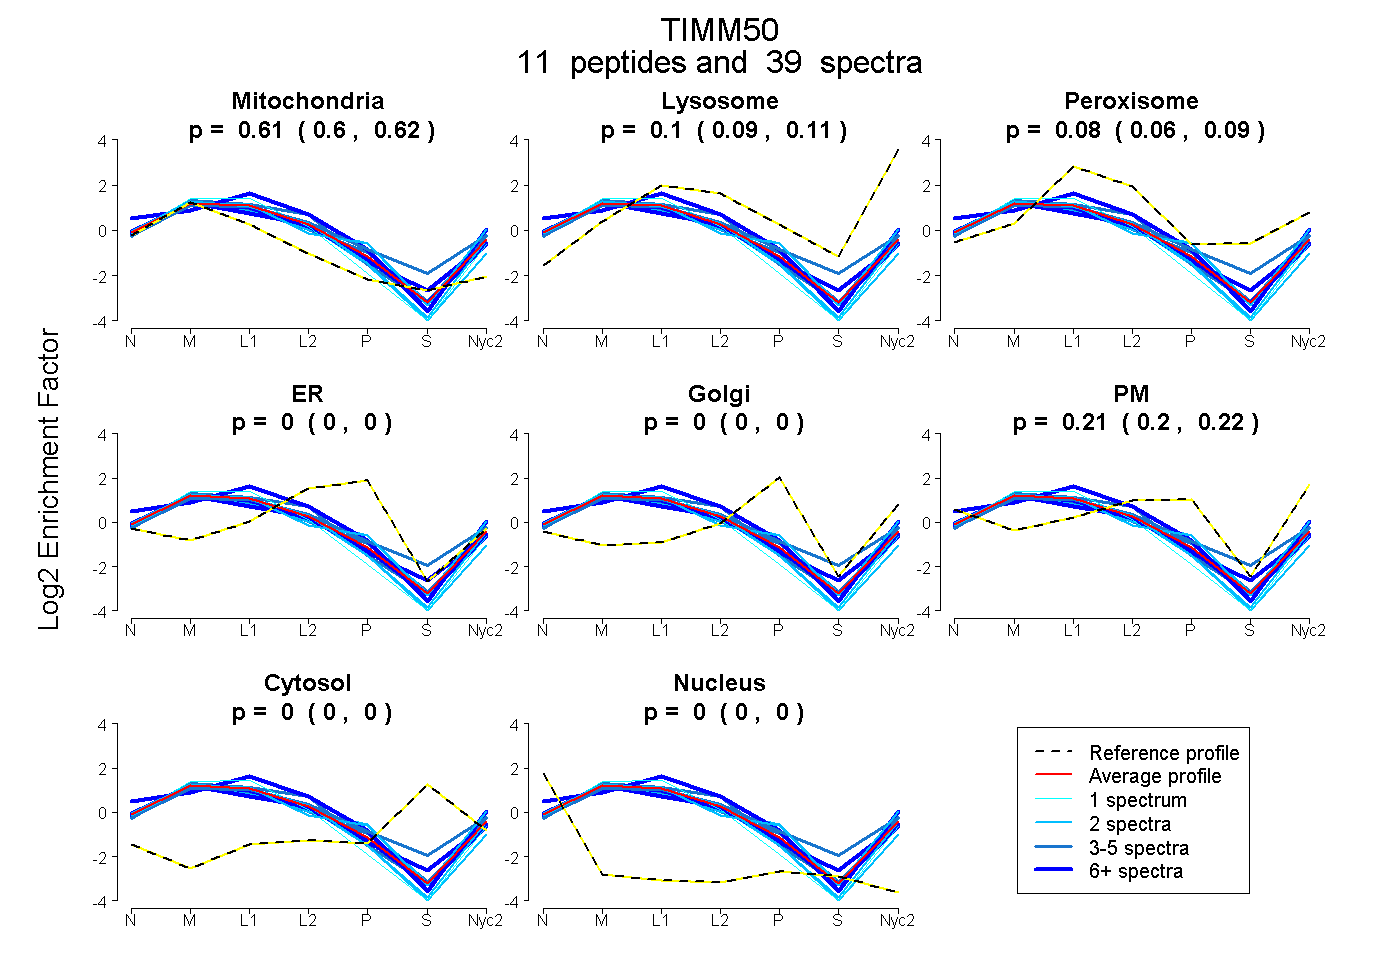
0.605 | 0.617
0.092 | 0.111
0.064 | 0.088
0.000 | 0.000
0.000 | 0.000
0.199 | 0.217
0.000 | 0.000
0.000 | 0.000
7peptides
spectra
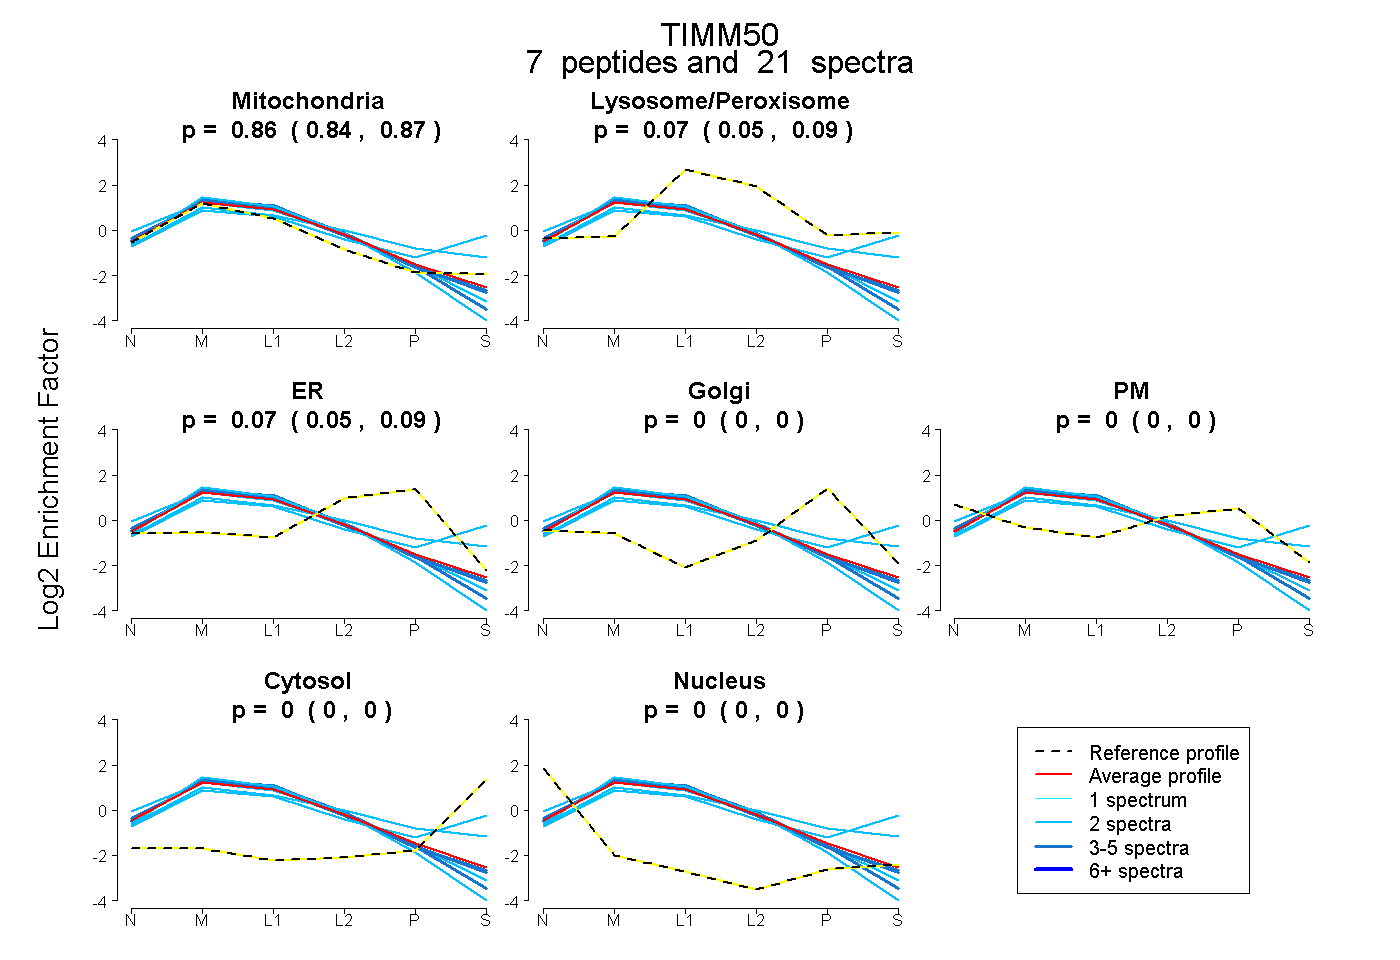
0.844 | 0.869
0.047 | 0.093
0.052 | 0.086
0.000 | 0.000
0.000 | 0.000
0.000 | 0.000
0.000 | 0.000
13peptides
spectra
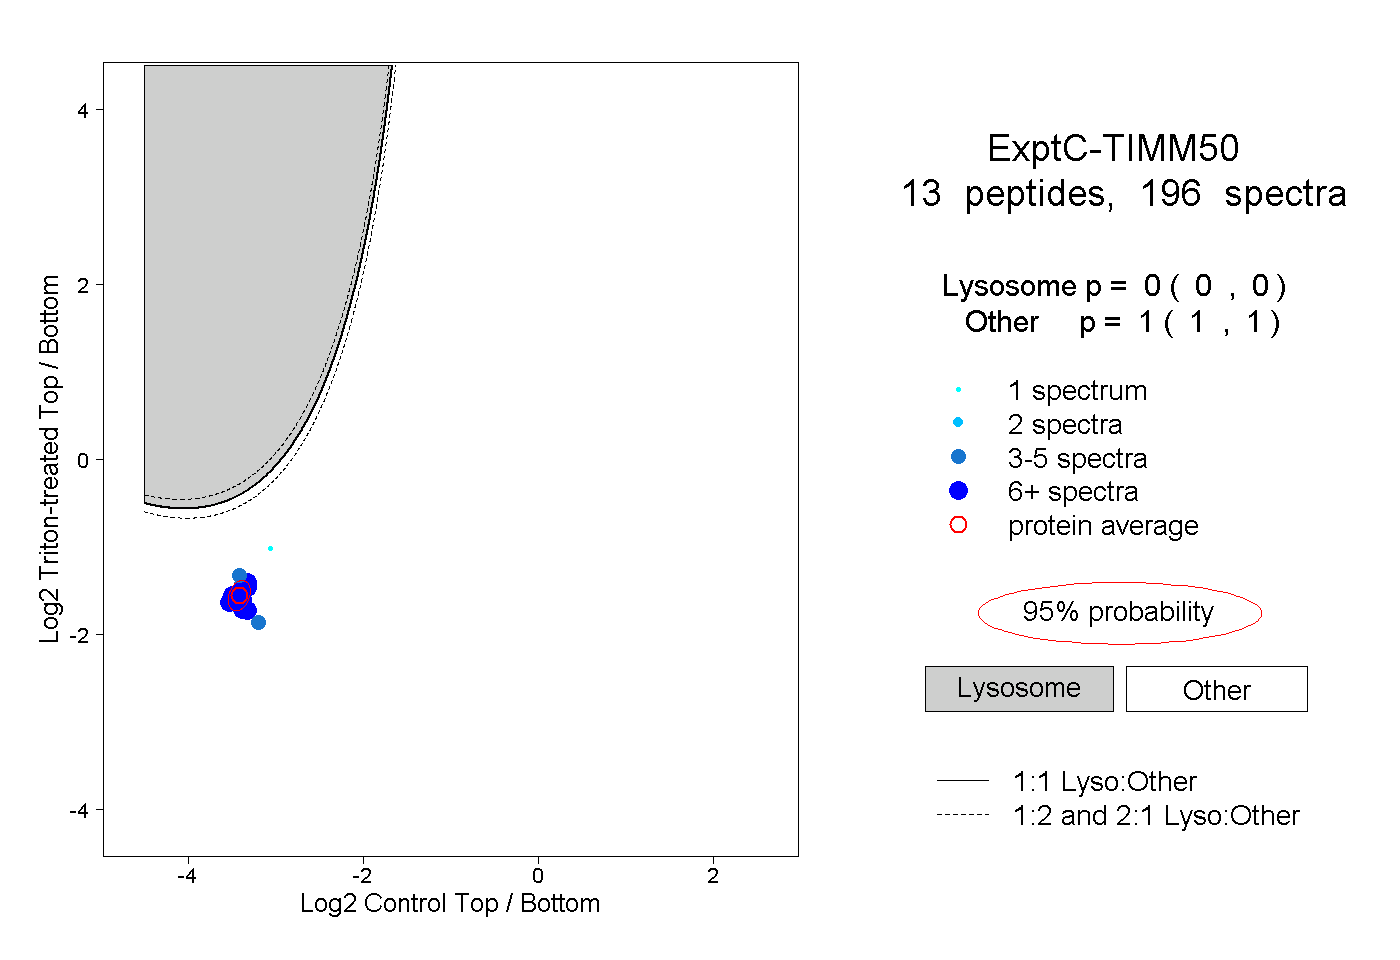
0.000 | 0.000
1.000 | 1.000
7peptides
spectra
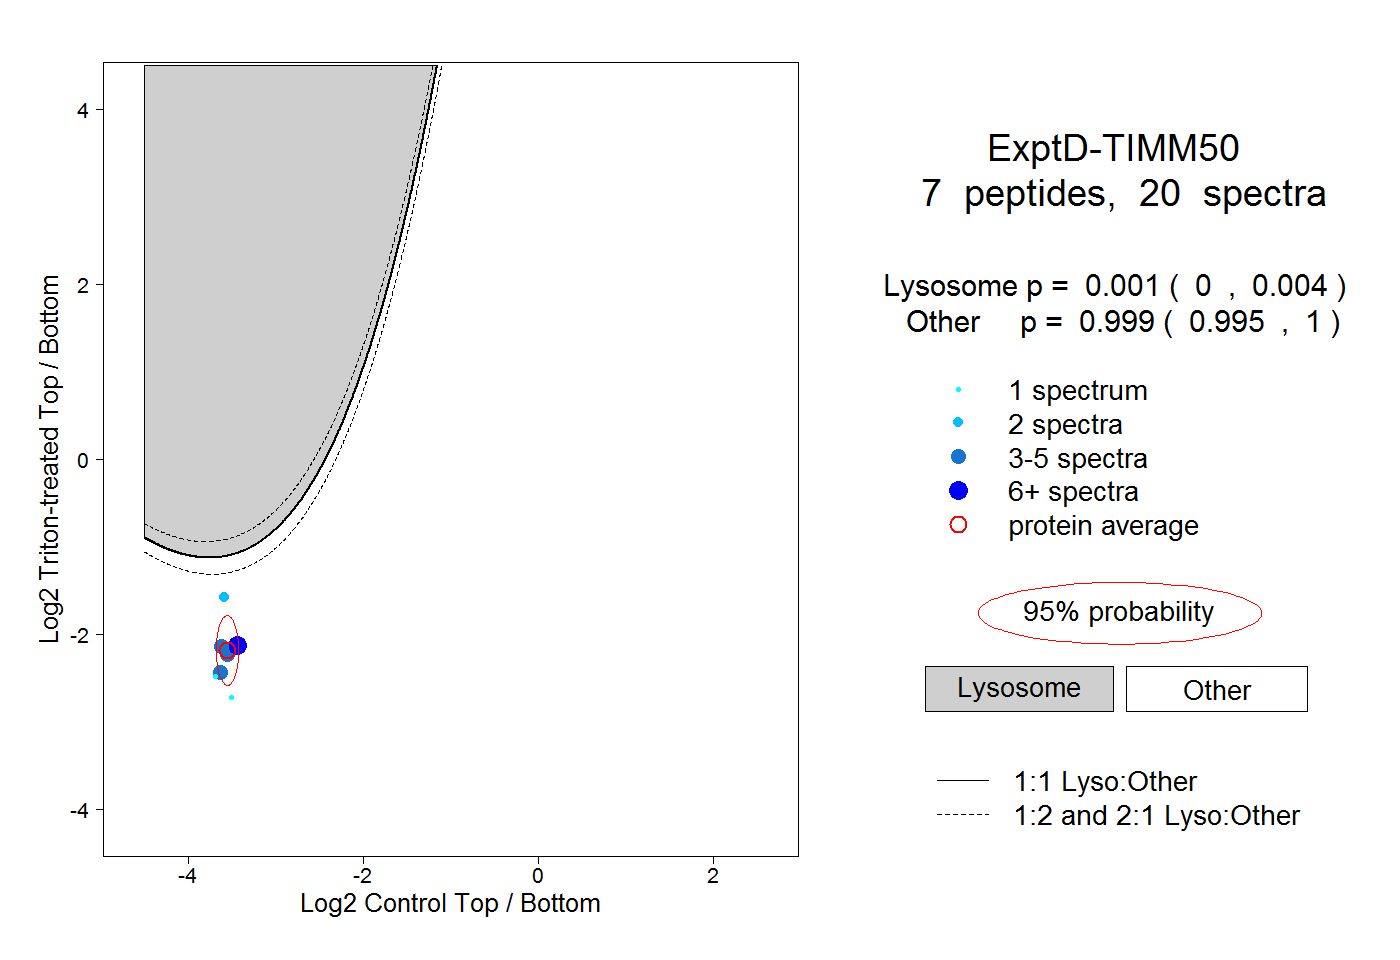
0.000 | 0.004
0.995 | 1.000