 11
11peptides
spectra
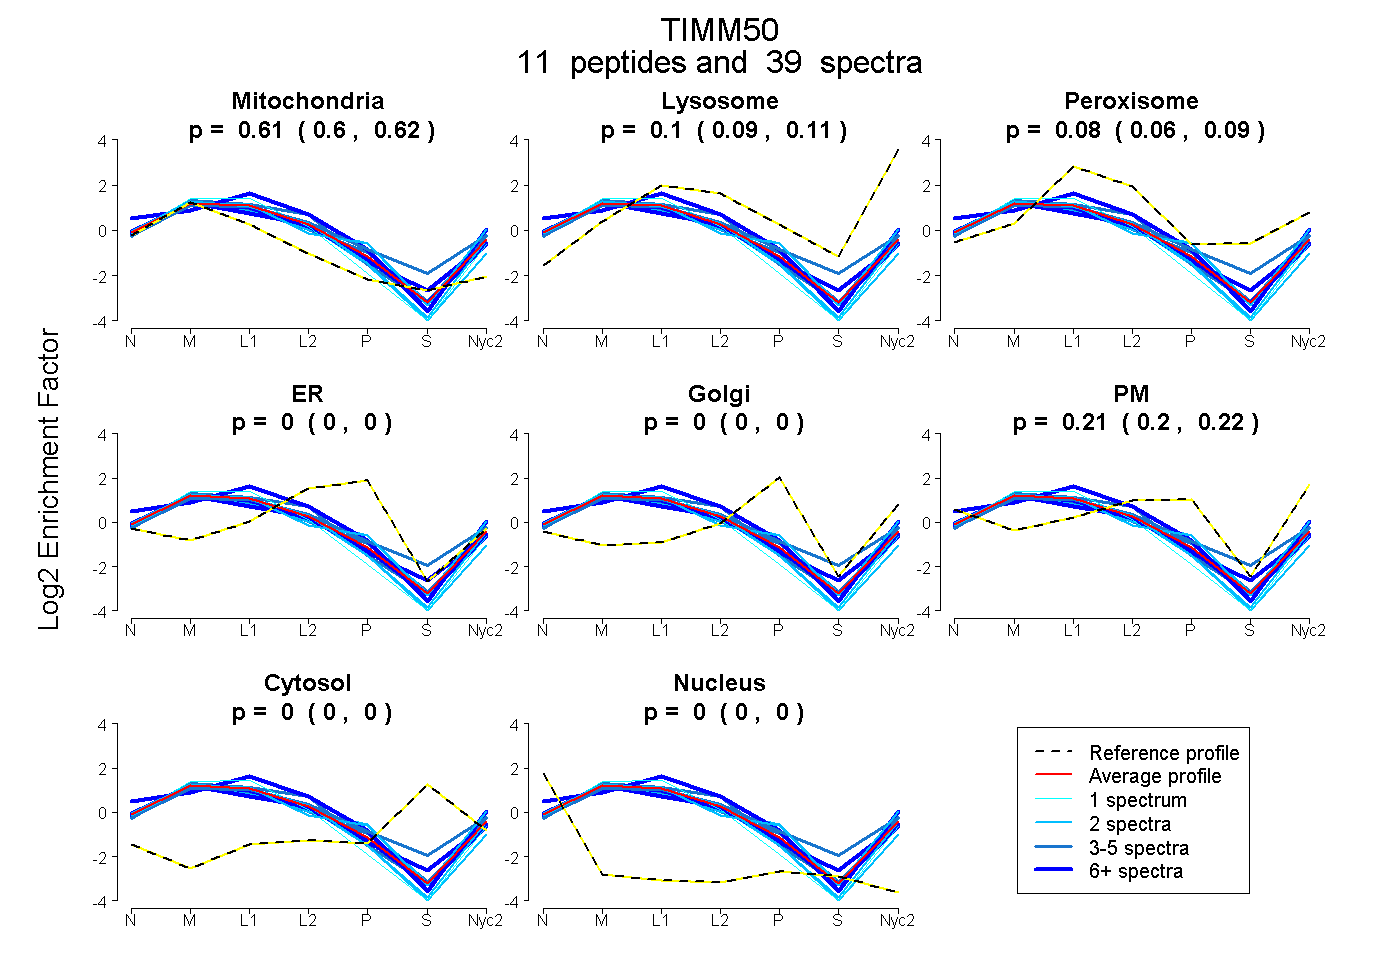
0.605 | 0.617
0.092 | 0.111
0.064 | 0.088
0.000 | 0.000
0.000 | 0.000
0.199 | 0.217
0.000 | 0.000
0.000 | 0.000
| Plot | Mito | Lyso | Perox | ER | Golgi | PM | Cytosol | Nucleus | |||||
| Expt A |
11 peptides |
39 spectra |
|
0.612 0.605 | 0.617 |
0.102 0.092 | 0.111 |
0.077 0.064 | 0.088 |
0.000 0.000 | 0.000 |
0.000 0.000 | 0.000 |
0.209 0.199 | 0.217 |
0.000 0.000 | 0.000 |
0.000 0.000 | 0.000 |
| 3 spectra, TVLEHYALEDDPLEAFK | 0.497 | 0.103 | 0.245 | 0.000 | 0.000 | 0.155 | 0.000 | 0.000 | ||
| 2 spectra, VLLDLSAFLK | 0.669 | 0.128 | 0.000 | 0.000 | 0.000 | 0.203 | 0.000 | 0.000 | ||
| 7 spectra, TPEQVTEIANR | 0.643 | 0.059 | 0.085 | 0.000 | 0.000 | 0.213 | 0.000 | 0.000 | ||
| 2 spectra, LEQEEQQR | 0.742 | 0.052 | 0.000 | 0.074 | 0.000 | 0.132 | 0.000 | 0.000 | ||
| 6 spectra, TIALNQVEDVR | 0.641 | 0.102 | 0.105 | 0.000 | 0.000 | 0.151 | 0.000 | 0.000 | ||
| 2 spectra, YMEGHHVK | 0.551 | 0.159 | 0.000 | 0.000 | 0.000 | 0.289 | 0.000 | 0.000 | ||
| 2 spectra, LAPPPPR | 0.592 | 0.097 | 0.000 | 0.133 | 0.000 | 0.178 | 0.000 | 0.000 | ||
| 7 spectra, QGLFFGSLTSR | 0.428 | 0.000 | 0.194 | 0.000 | 0.000 | 0.378 | 0.000 | 0.000 | ||
| 4 spectra, DISCLNR | 0.637 | 0.114 | 0.017 | 0.035 | 0.000 | 0.198 | 0.000 | 0.000 | ||
| 3 spectra, LQPFNGVALRPWDGNSDDR | 0.608 | 0.187 | 0.104 | 0.000 | 0.000 | 0.101 | 0.000 | 0.000 | ||
| 1 spectrum, TQGPQHQPGSEGPSYAK | 0.768 | 0.198 | 0.000 | 0.000 | 0.000 | 0.034 | 0.000 | 0.000 |
| Plot | Mito | Lyso or Perox | ER | Golgi | PM | Cytosol | Nucleus | ||||||
| Expt B |
7 peptides |
21 spectra |
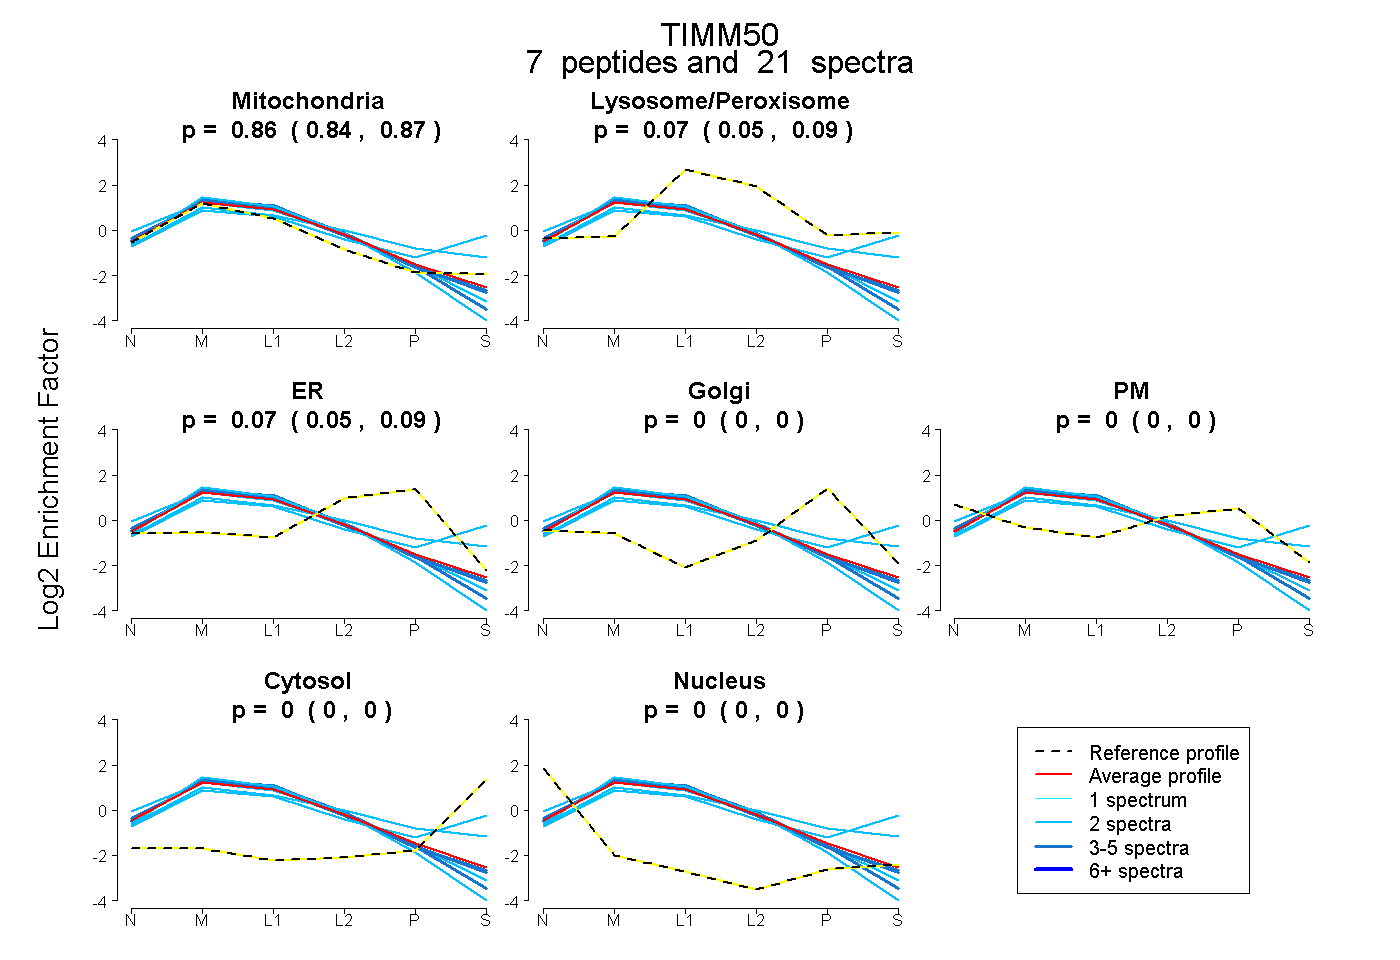 |
0.857 0.844 | 0.869 |
0.073 0.047 | 0.093 |
0.070 0.052 | 0.086 |
0.000 0.000 | 0.000 |
0.000 0.000 | 0.000 |
0.000 0.000 | 0.000 |
0.000 0.000 | 0.000 |
|||
| Plot | Lyso | Other | |||||||||||
| Expt C |
13 peptides |
196 spectra |
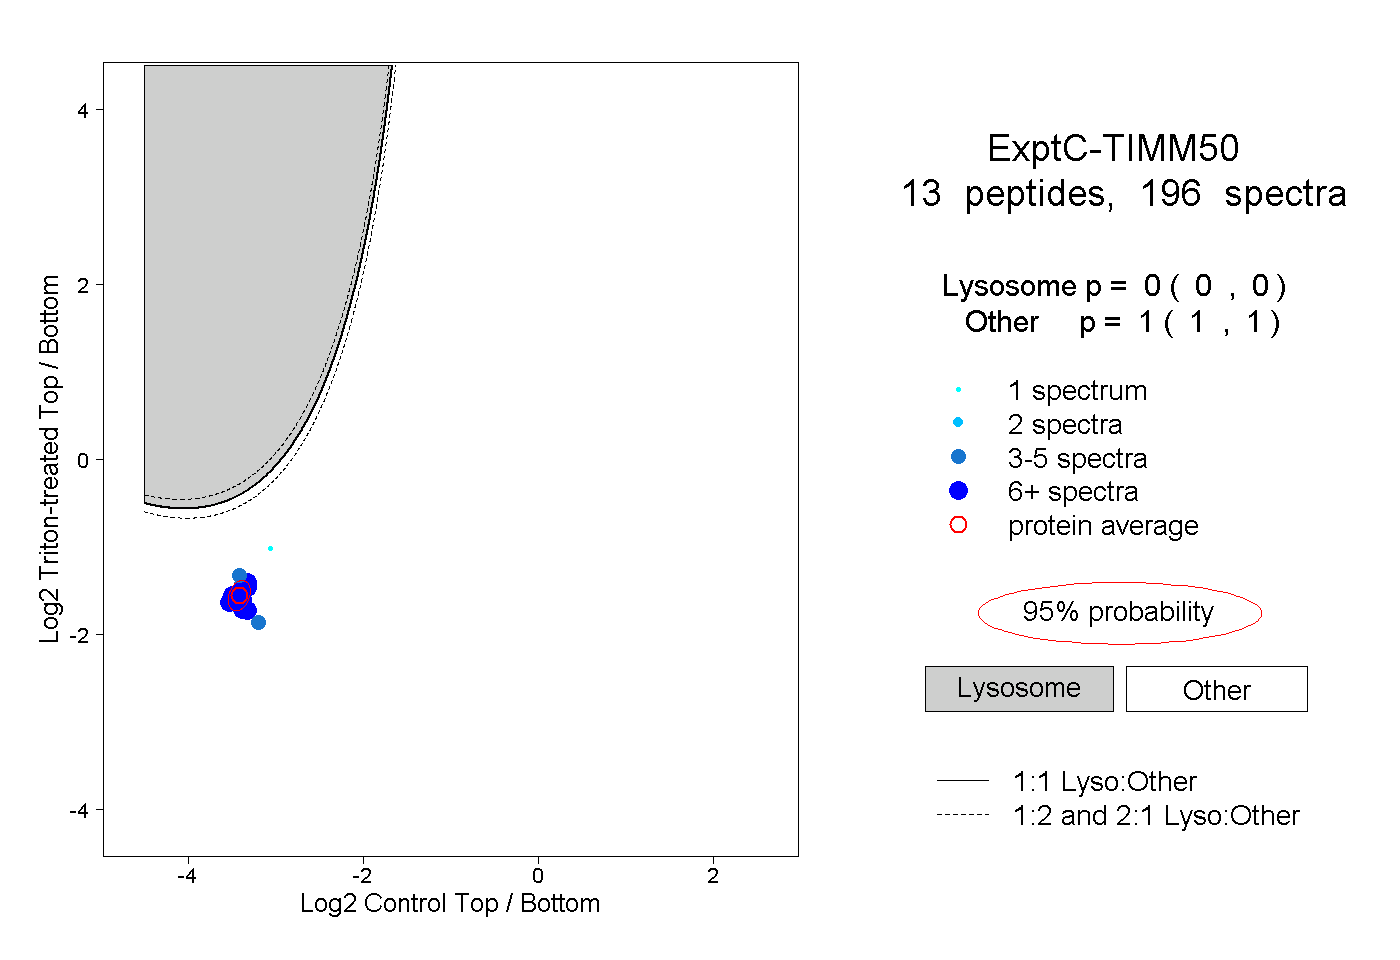 |
0.000 0.000 | 0.000 |
1.000 1.000 | 1.000 |
||||||||
| Plot | Lyso | Other | |||||||||||
| Expt D |
7 peptides |
20 spectra |
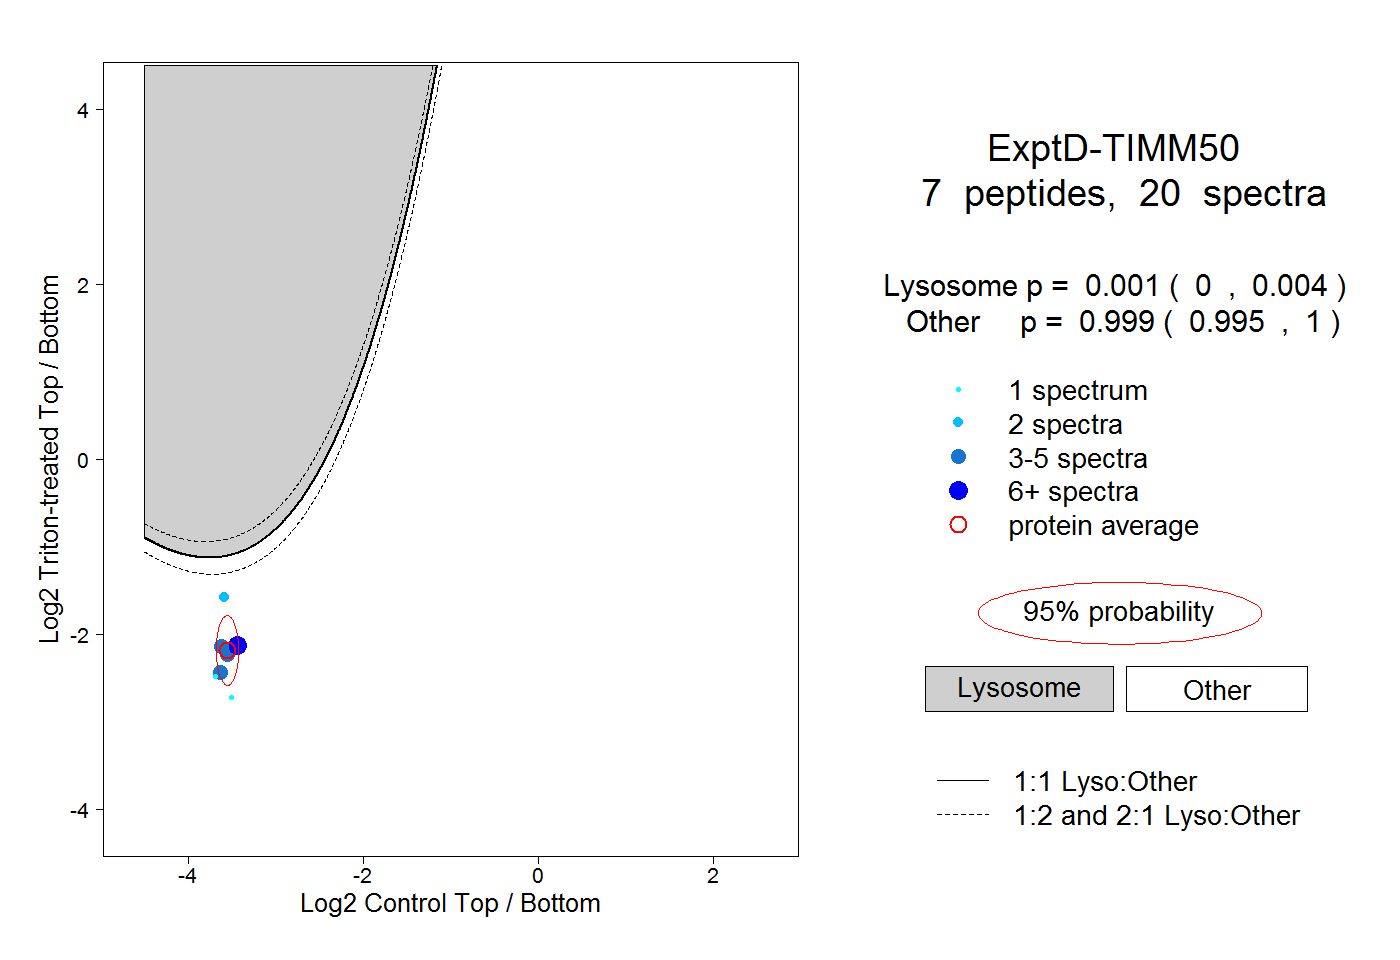 |
0.001 0.000 | 0.004 |
0.999 0.995 | 1.000 |