 3
3peptides
spectra
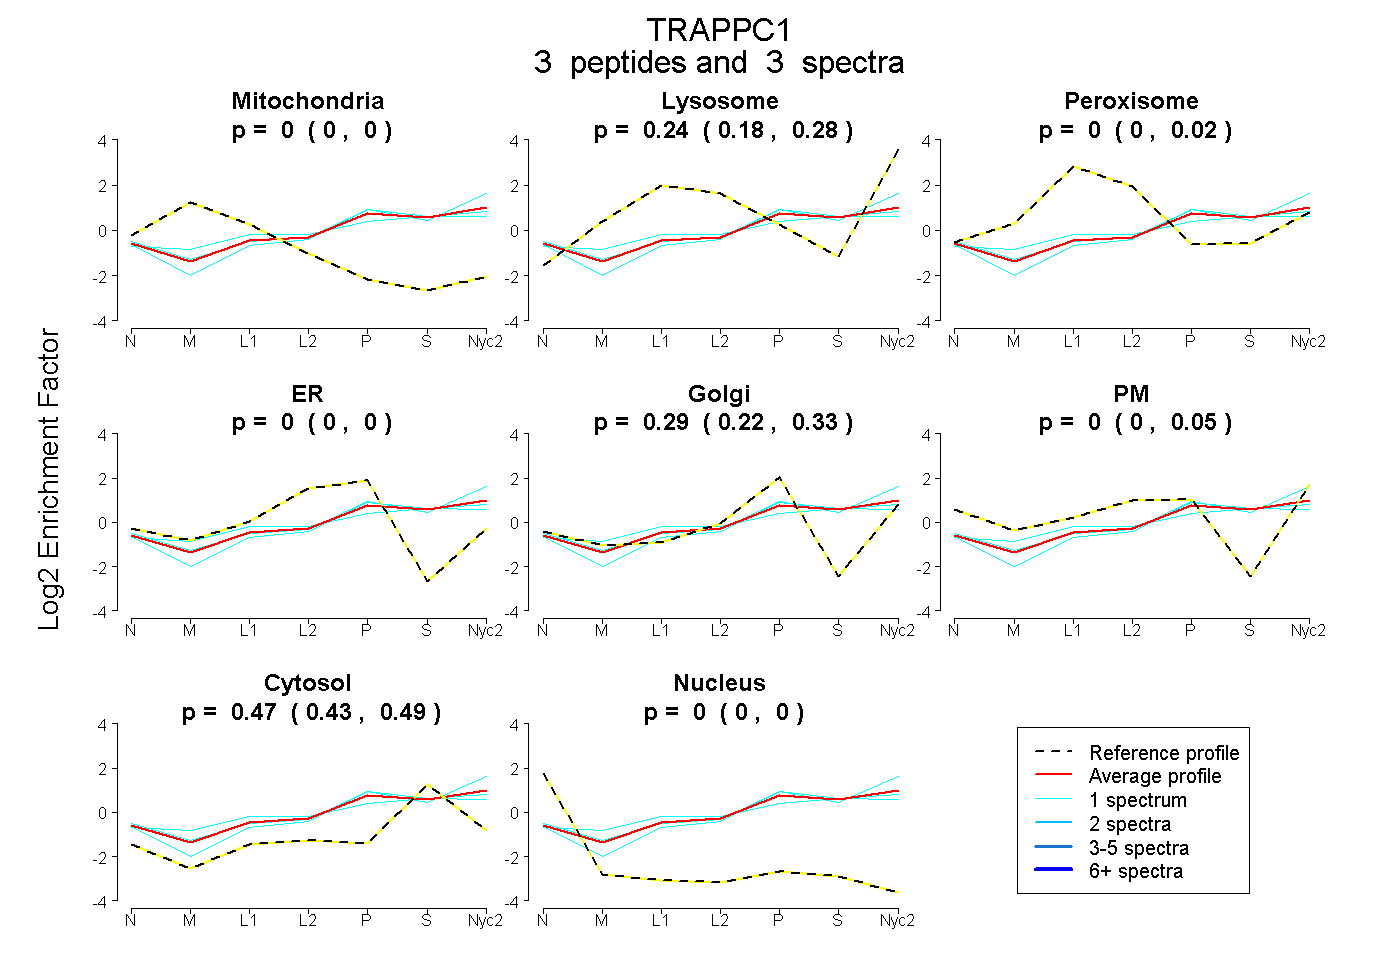
0.000 | 0.000
0.180 | 0.279
0.000 | 0.015
0.000 | 0.000
0.218 | 0.328
0.000 | 0.054
0.432 | 0.494
0.000 | 0.000
1peptide
spectra
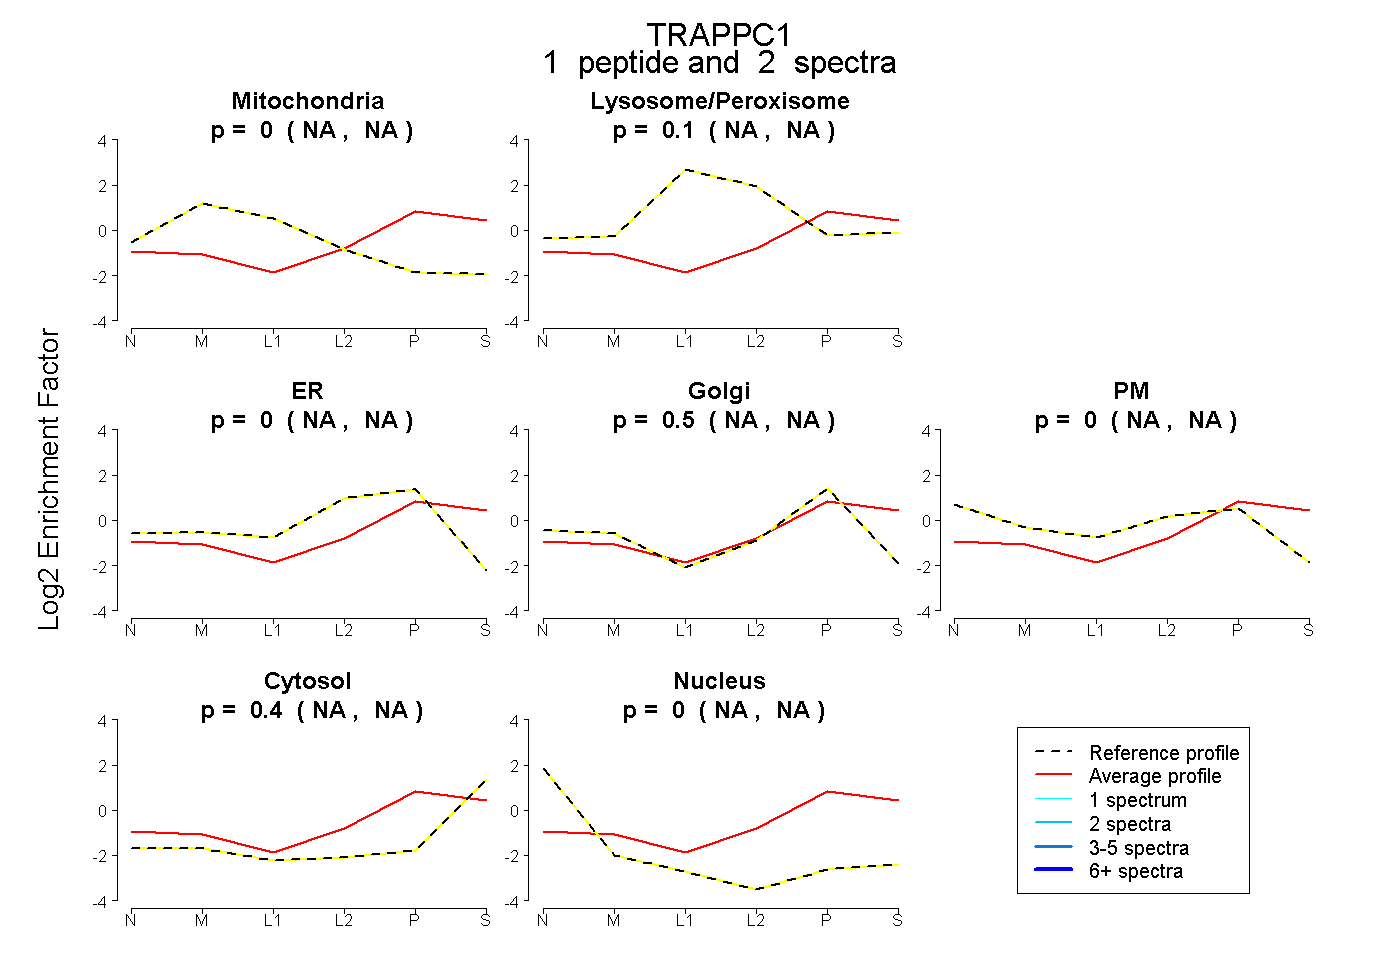
NA | NA
NA | NA
NA | NA
NA | NA
NA | NA
NA | NA
NA | NA
1peptide
spectra
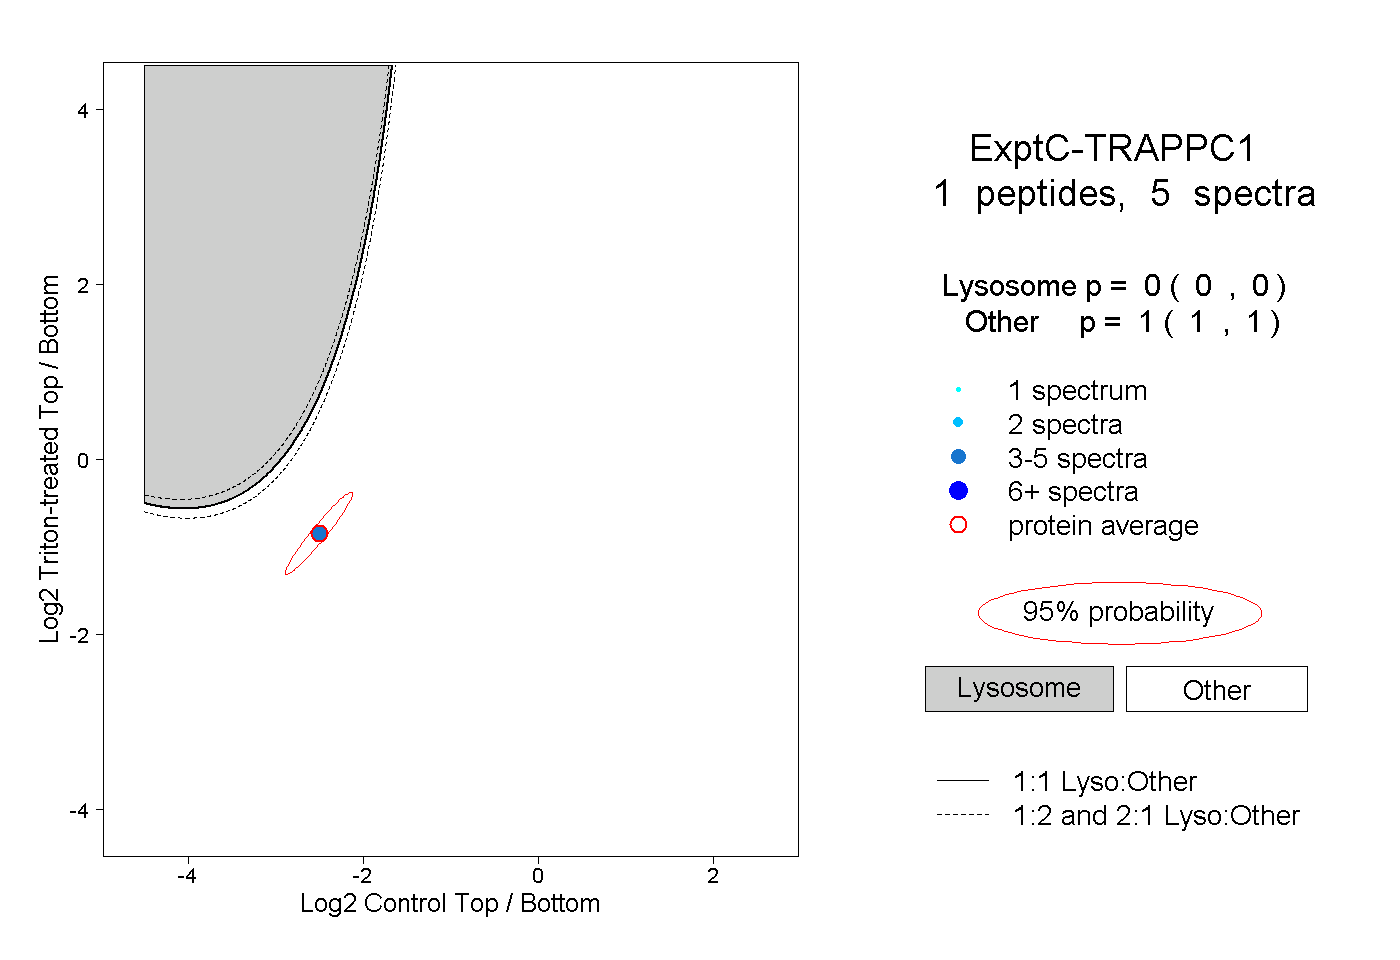
0.000 | 0.000
1.000 | 1.000